MT4 · MT5 · TradingView

The market leaves its levels behind.
These indicators find them.

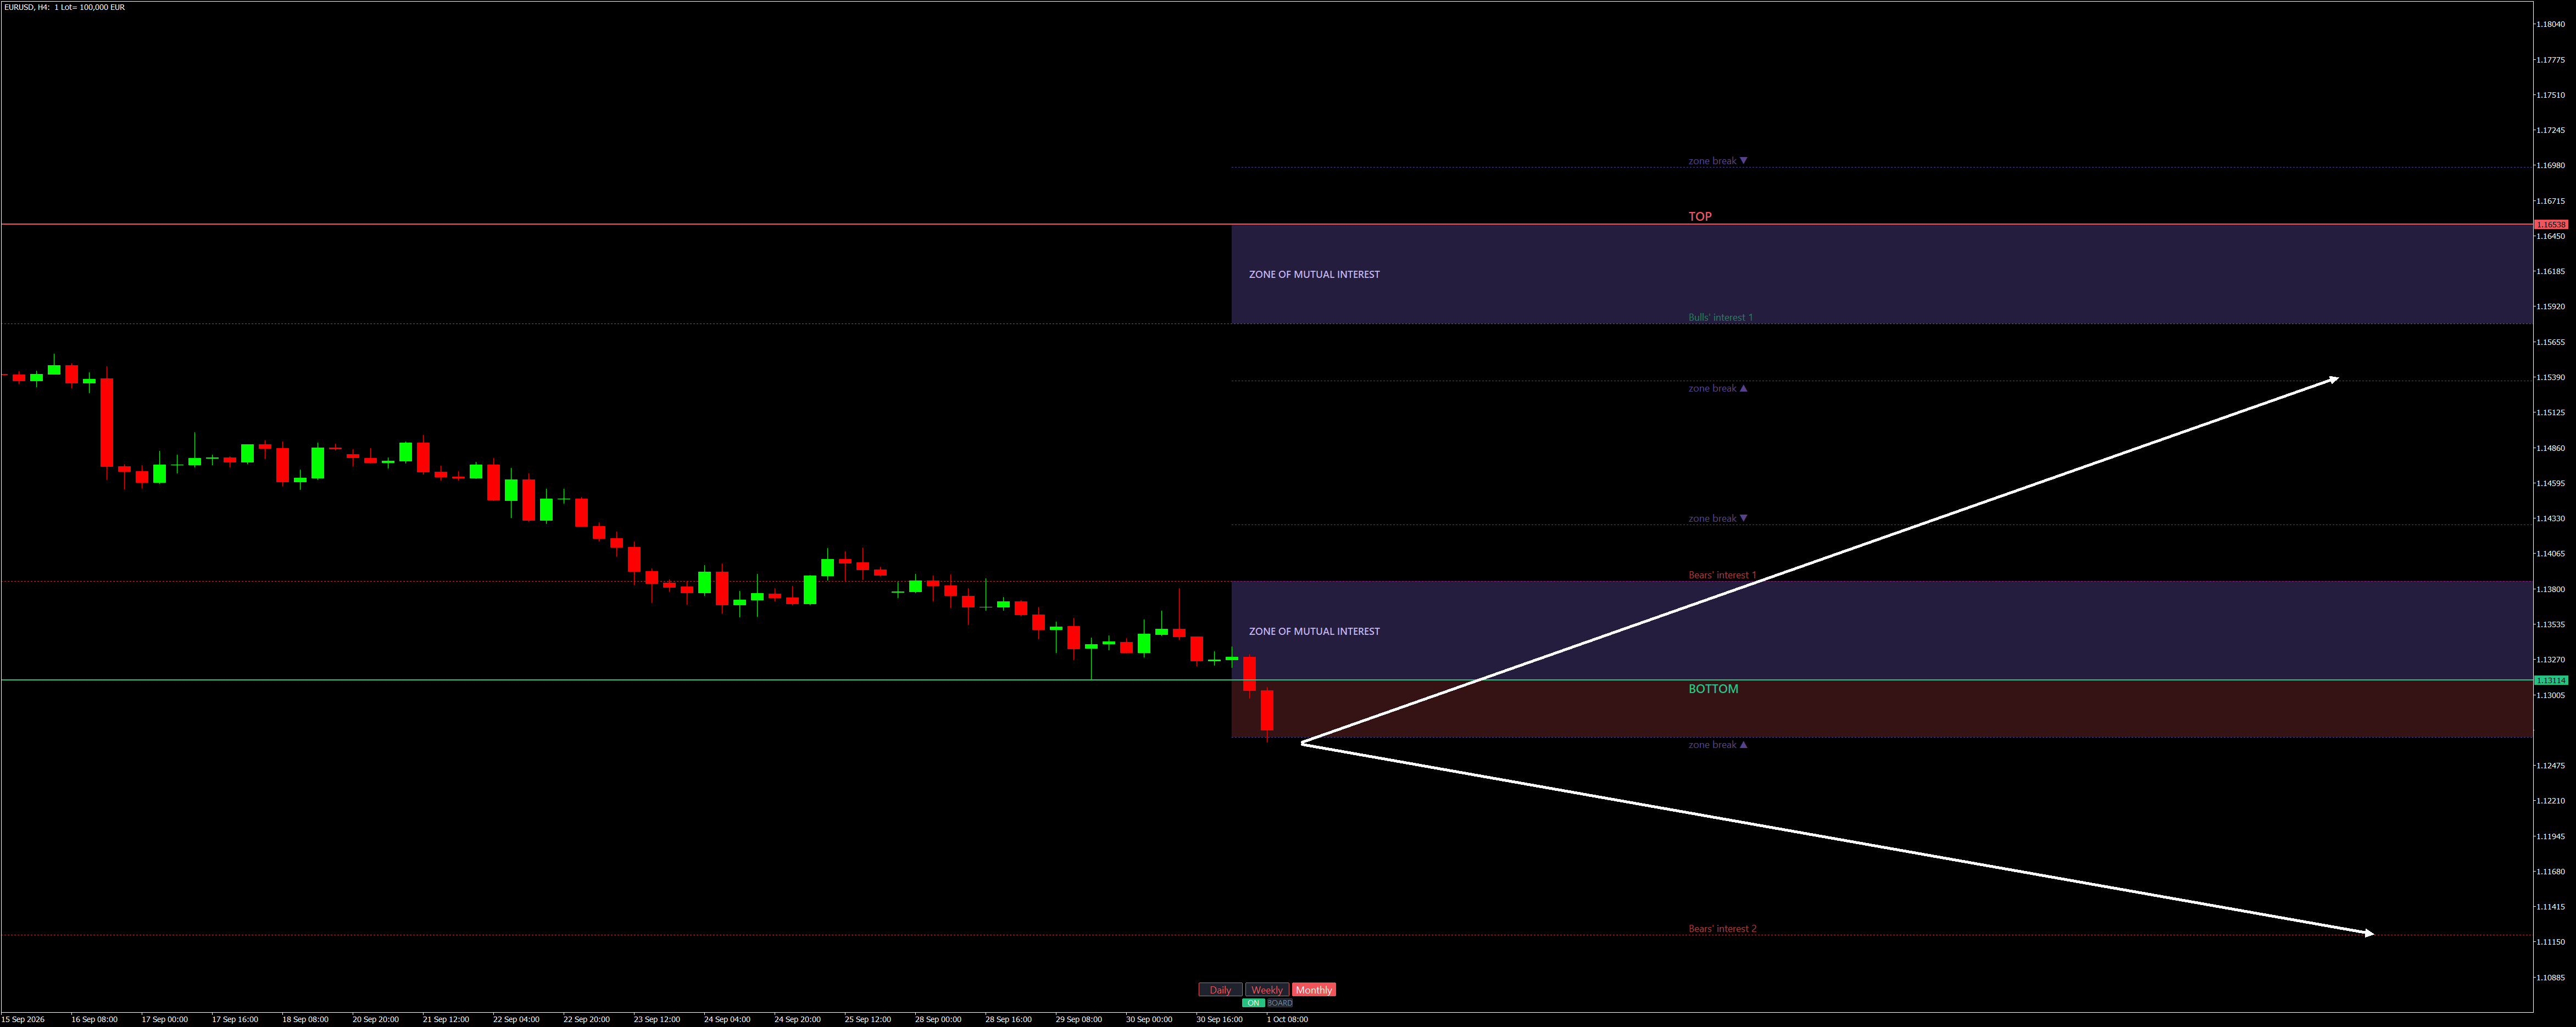
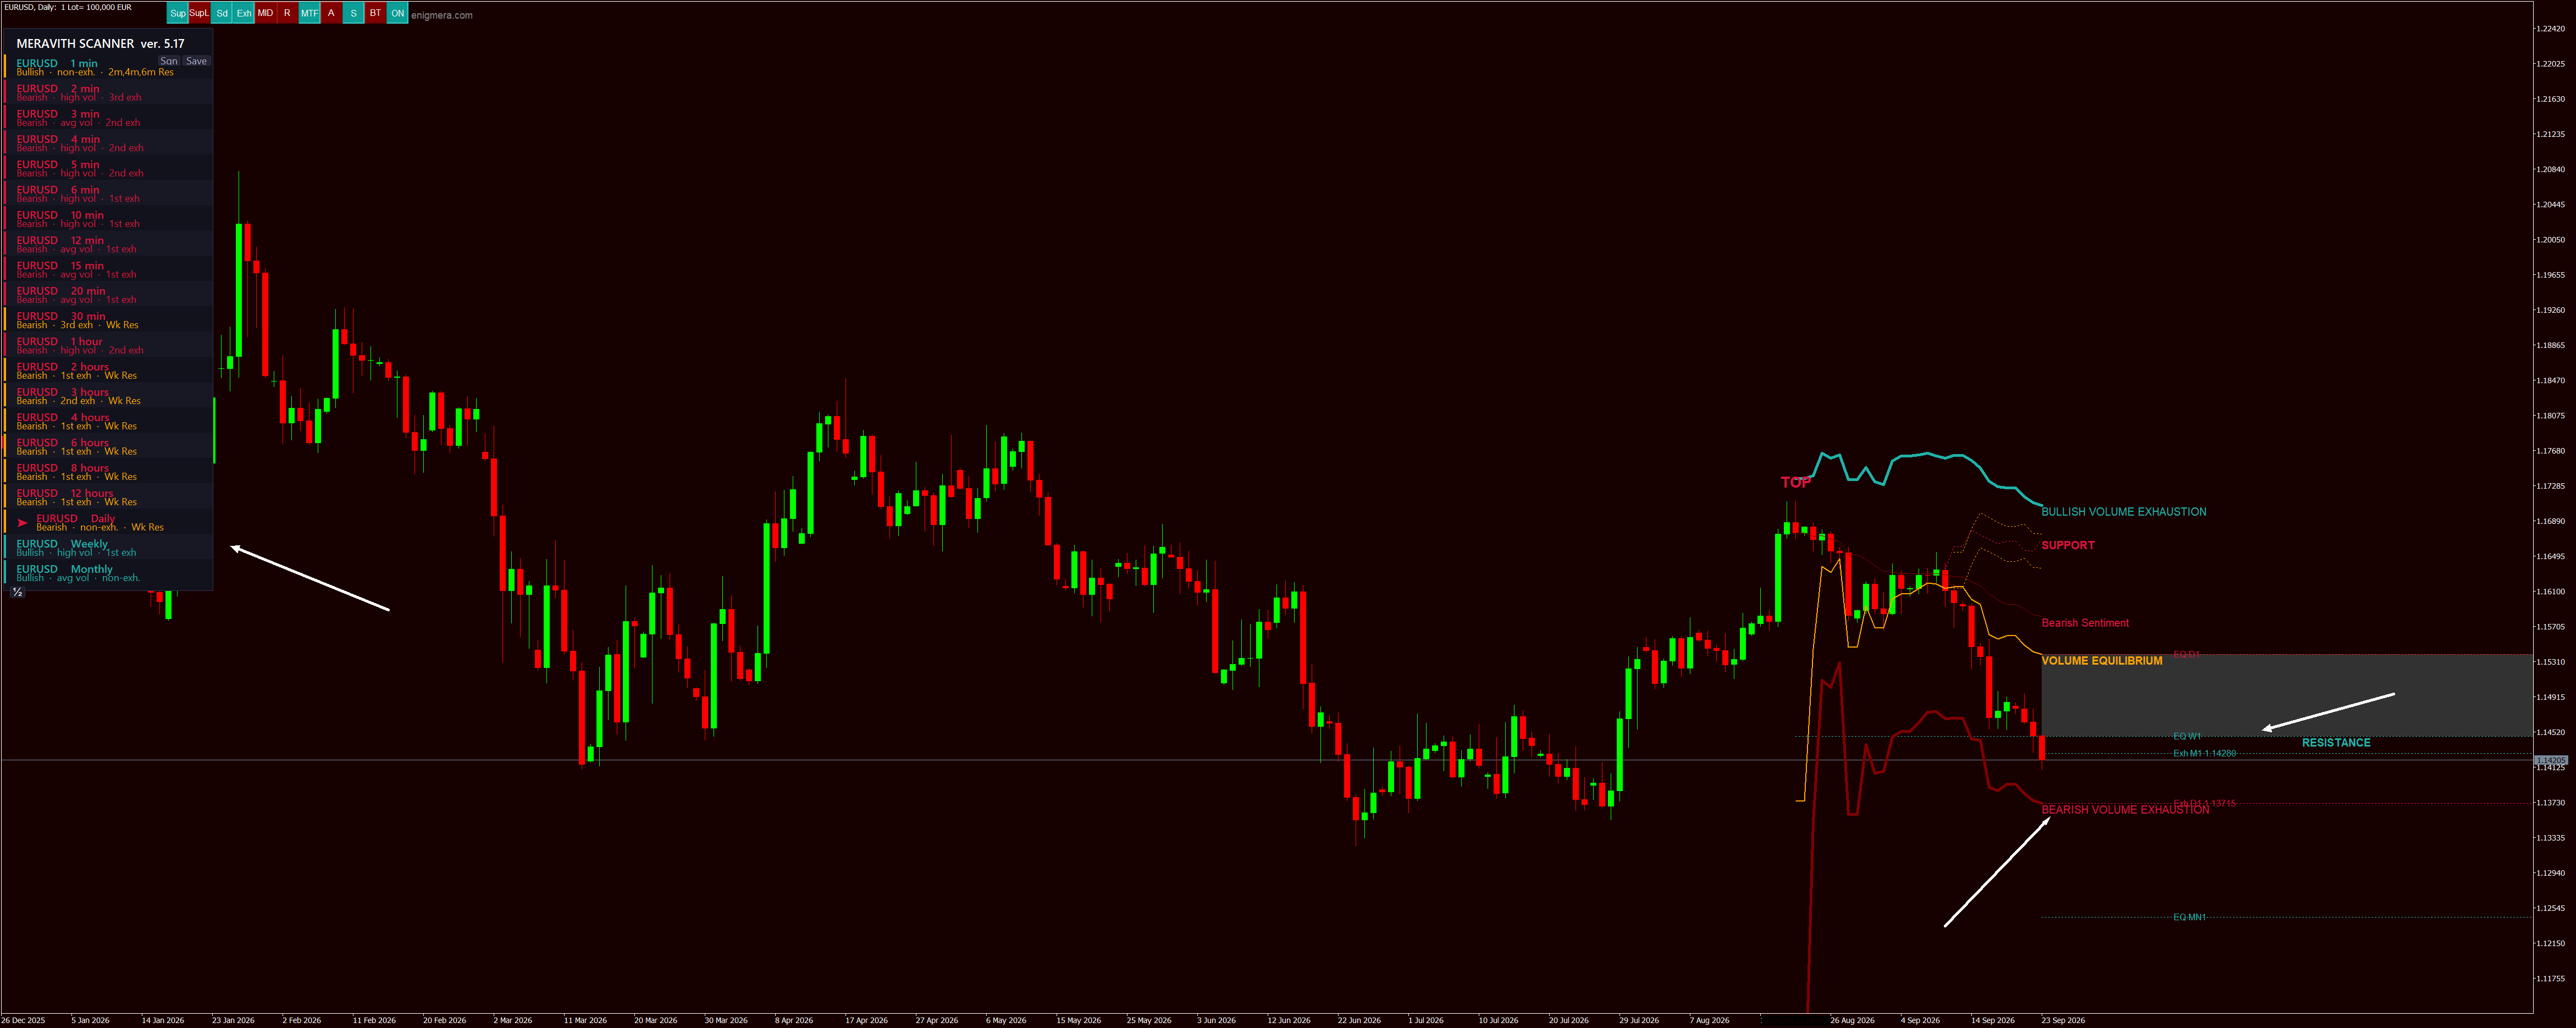
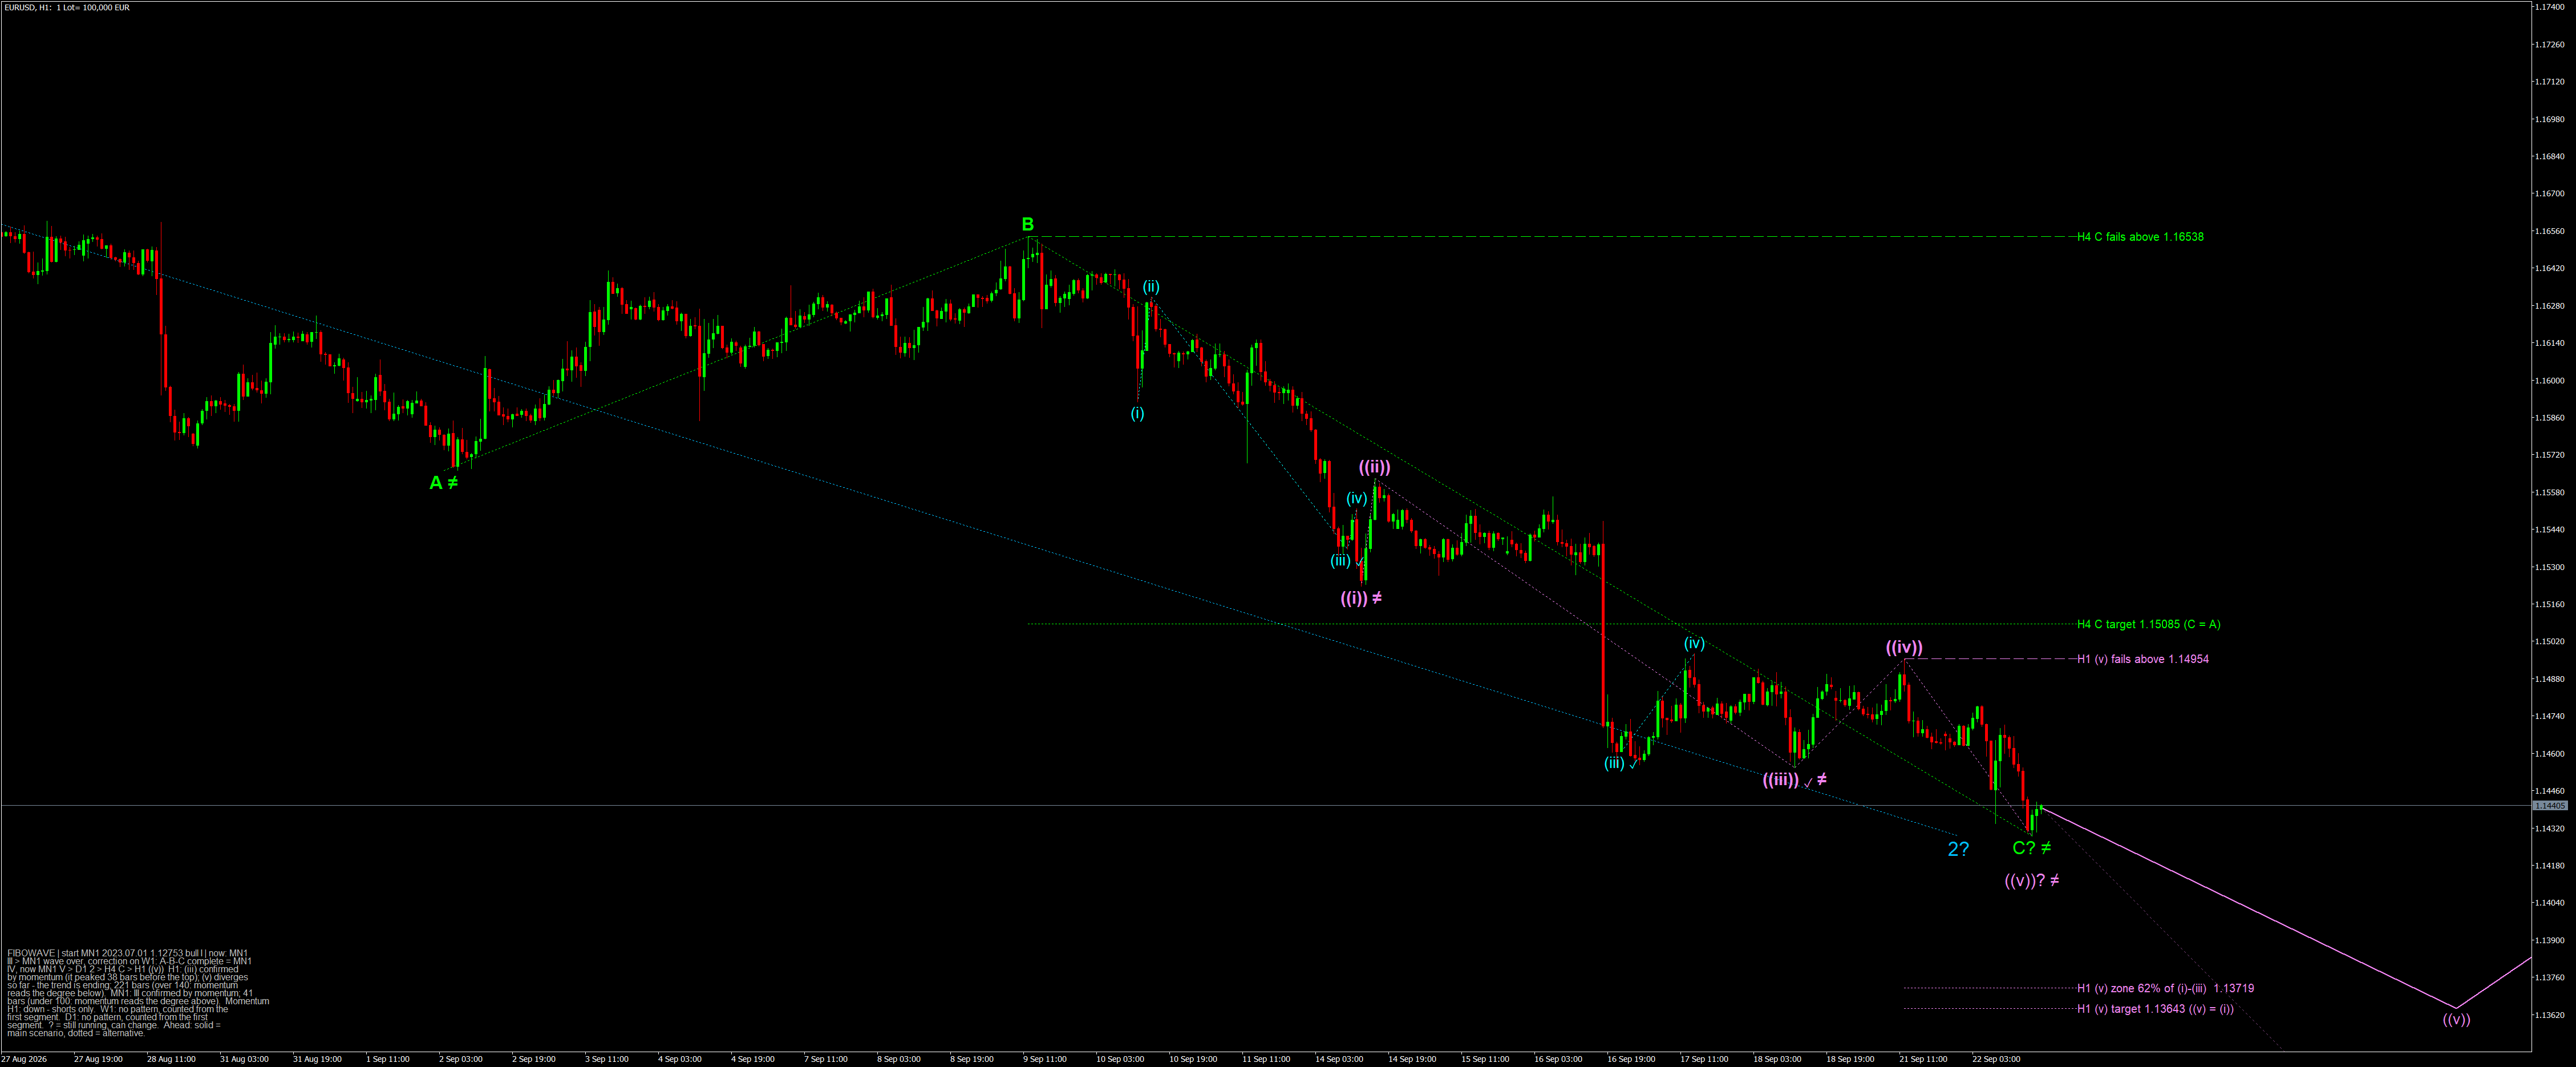
Review the market in full. MERAVITH shows you what is happening right now. It analyzes volume and price across every timeframe — from the lowest to the highest. It shows where financial interest is concentrated, where there is buying and where there is selling. This gives you market context — something ordinary indicators cannot provide.

  • Discover where price finds support
  • See where the indicator detects resistance
  • Check where trading volume runs out

Bought once, yours for good — or rented by the month. Written and supported by one developer, who answers.

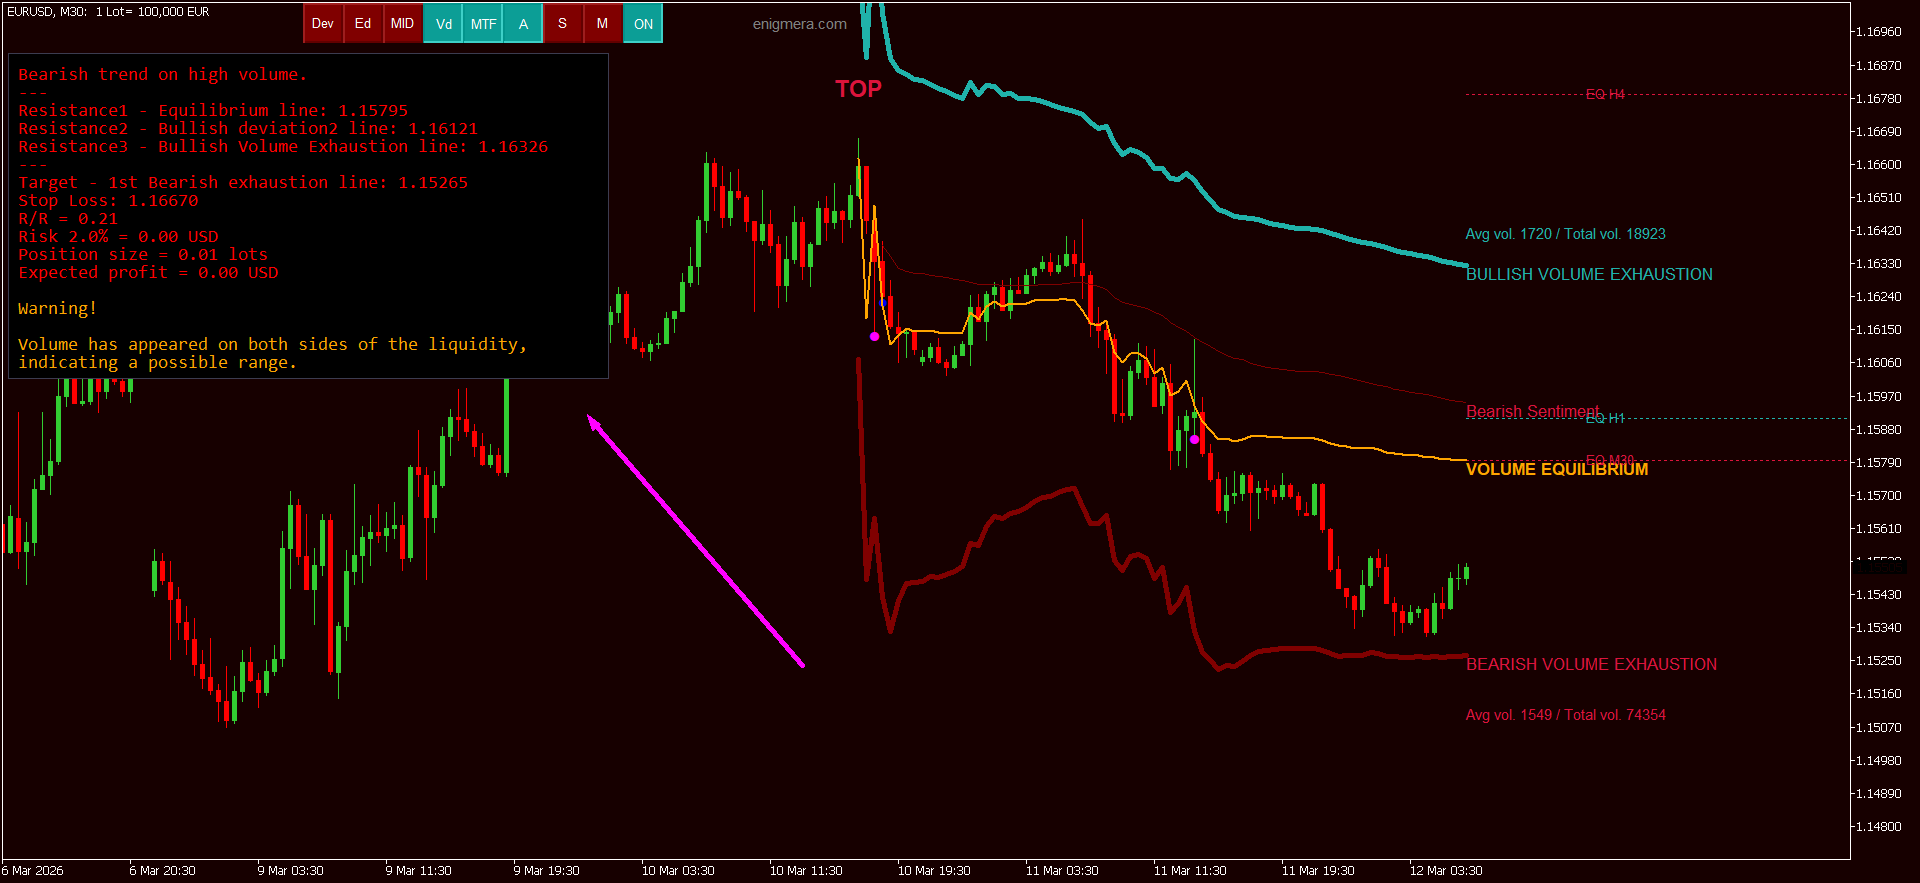
MERAVITH on EURUSD M30: the volume equilibrium line, both volume exhaustion levels, and the panel reading out resistances, target, stop loss and position size
MERAVITH on EURUSD M30 — and its own reading of what is on the chart
★★★★★

“By far, one of the best indicators I've ever bought. It's extremely accurate, and the support and attention from the creator are the best I've seen around here.”

Gabriel De Araujo Lobo · April 2026 · MQL5
★★★★★

“There is nothing else that can match this trading system. Finally something that makes sense and actually works. Ivan is kind and very helpful, he answers questions and gives good guidance.”

adrian100379 · July 2026 · MQL5
★★★★★

“The best system on the market. I recommend it with pleasure. He is happy to help you and works on improvements every day.”

Valeriu-alexandru Petrache · March 2026 · MQL5

Cuique pugnae sua instrumenta sunt

Today's Market Snapshot - 12 November 2026
Fresh market intelligence and trading notes, surfaced first.

Mengapa Market Utilities & EA Butuh Free Trial yang Sungguhan: 5 Alasan Meyakinkan yang Akan Mengubah Permainan

Alasan #1: Strategy Tester Bukan Pasar yang Sebenarnya — Dan Pelanggan Anda Tahu Itu!
Ketika klien Anda berinvestasi pada sebuah alat, mereka ingin melihat bagaimana alat itu benar-benar bekerja dalam kondisi pasar nyata. Strategy Tester tidak bisa meniru variabel live seperti spread yang berubah, slippage, atau jeda eksekusi real-time. Pelanggan Anda tahu itu — mereka cerdas, dan mereka ingin melihat bukti kinerja yang nyata.

Alasan #2: Demo Berbayar Membunuh Penjualan — Free Trial Mendongkraknya!
Bayangkan menawarkan trial seharga $30 hanya untuk menguji sebuah produk selama sebulan. Itu penghalang yang membuat calon pembeli mundur. Bahkan trial $5 per hari pun terasa merepotkan. Free trial yang sungguhan menghapus hambatan itu sepenuhnya, membiarkan pengguna menguji seketika, meningkatkan kepercayaan, dan pada akhirnya mendorong lebih banyak konversi.

Alasan #3: Free Trial Menghasilkan Banjir Ulasan Autentik dan Bukti Sosial**
Ketika pengujiannya gratis dan mudah, pelanggan lebih banyak terlibat, meninggalkan lebih banyak ulasan, dan berbagi masukan yang jujur. Ini menciptakan marketplace yang transparan di mana utility berkualitas tinggi bersinar lewat ulasan pengguna yang autentik. Ini menguntungkan semua pihak: developer yang serius mendapat sorotan yang layak mereka terima, dan pembeli membuat pilihan dengan informasi yang cukup.

Alasan #4: Ucapkan Selamat Tinggal pada Backtest Menyesatkan dan Data yang Membingungkan
Tidak semua pengguna ahli dalam backtest. Faktanya, banyak yang tidak tahu cara melakukannya dengan benar. Kalau data broker mereka tidak lengkap, Strategy Tester bisa menghasilkan angka-angka fantasi. Free trial di akun live membuat mereka melihat kinerja nyata di akun mereka sendiri, menghapus kebingungan dan membangun kepercayaan.

Alasan #5: Keyakinan Sejati Itu Transparan — Dan Transparansi Itu Menjual
Kalau Anda percaya pada produk Anda, biarkan produk itu bicara sendiri. Menawarkan free trial menunjukkan keyakinan dan integritas. Seperti yang sering dikatakan komunitas: “Mereka yang tidak takut pada produknya sendiri tidak punya apa pun untuk disembunyikan.”
Itu pesan pemasaran yang kuat dan membedakan Anda dari pesaing.

---

Kesimpulan: Ubah Free Trial Menjadi Keunggulan Kompetitif Anda
Mengadopsi model free trial yang sungguhan bukan sekadar soal kemudahan — ini langkah strategis yang bisa mengubah kesuksesan Anda di marketplace.
Siap melihat bedanya? Tawarkan free trial dan saksikan kredibilitas serta penjualan produk Anda melesat!
Share post:
Facebook X LinkedIn Telegram WhatsApp
Markets today MERAVITH · D1
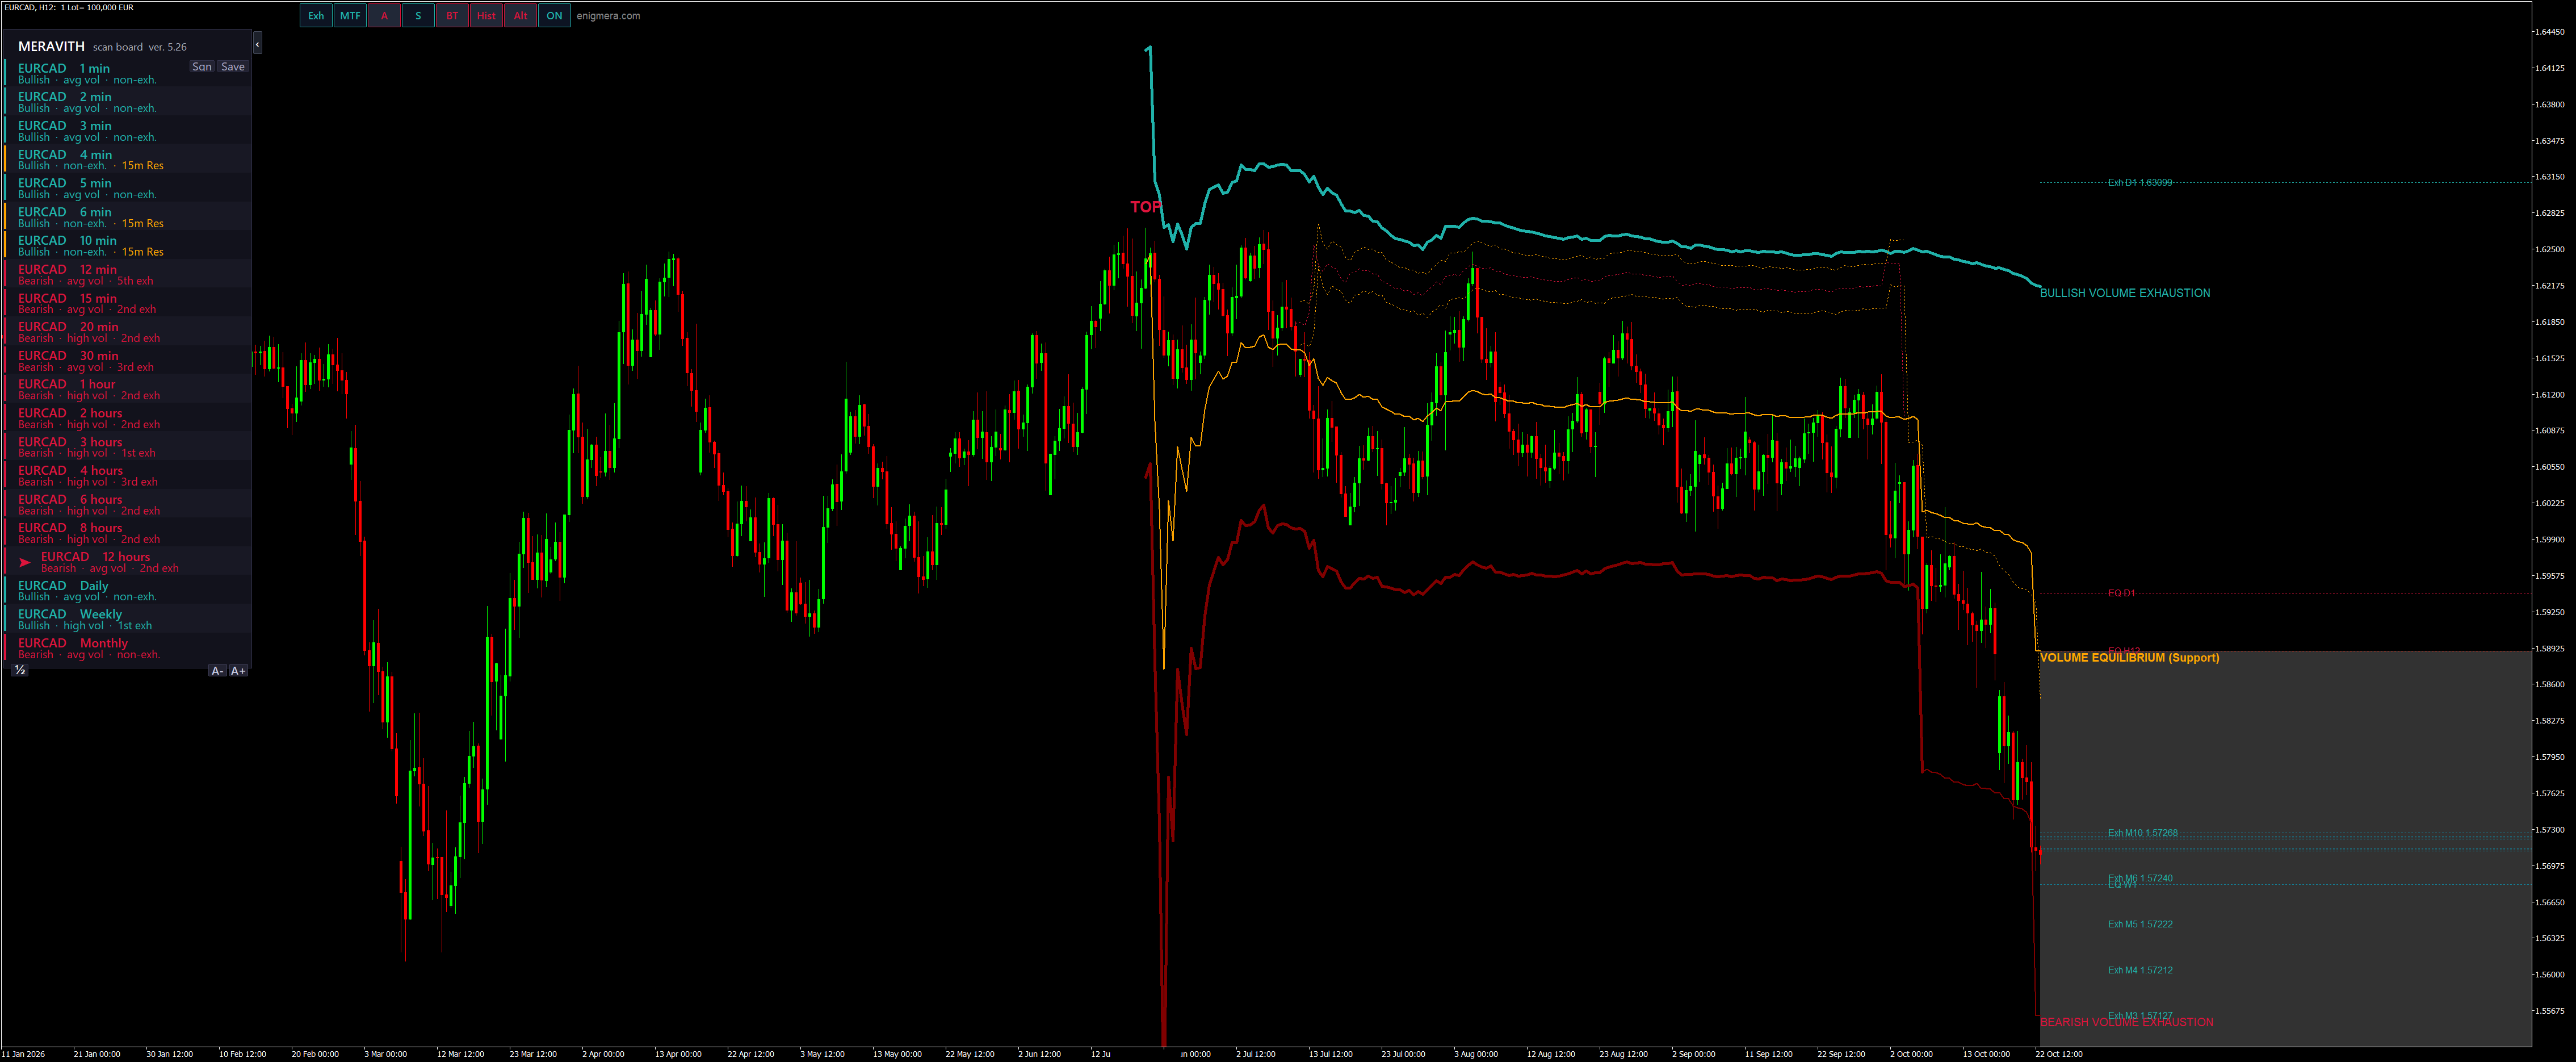
Today's trading example EURCAD
One EURCAD trade, from the scan to the exit
The scan, the exhausted cluster, the entry with Alt and the exit at the higher resistances.
Watch on YouTube

MERAVITH on the daily chart, last closed day: 05.11.2026 · Not investment advice.

Journal

Trading Far from Fair Value vs. Trend Trading

There are two main ways to trade the market. The first follows the trend and relies on the move continuing. The second trades the return of price to its fair value and relies on the move having gone too far. This article explains why tradin…
Read full post

Need a target? Think about this!

The Target Question: A Matter of Logic Logic first The most important thing in trading is logic. When we apply logic, we achieve results. This article asks one logical question to every reader. There is no ready answer here. Each reader is …
Read full post

Context Is King

How Trading Indicators Really Work Trading indicators do not predict the market. They interpret market data through the algorithms built into them. An indicator does not truly know whether the market is bullish or bearish. It simply display…
Read full post
Page 1 of 3
Analysis
EUR/CAD: a buy after an exhausted bearish Swarm

EUR/CAD: a buy after an exhausted bearish Swarm NEW

1. What the scan shows After a MERAVITH scan, EURCAD shows a run of timeframes from M12 to H12 that are all bearish, and every one of these bearish trends is already exhausted. We call such a group a Swarm: neighbouring timeframes that move in the same direction and have all reac…
Read analysis
What I traded today

What I traded today

One EURCAD trade, from the scan to the exit This is a real trade, read step by step with MERAVITH. 1. The scan. We started by scanning EURCAD on every timeframe, from one minute to one month. One thing stood out at once: from M30 up to H12, eight timeframes in a row were bearish.…
Read analysis
Page 1 of 7
Post Chat Public conversation between users
Loading chat...
Be respectful and stay on topic.