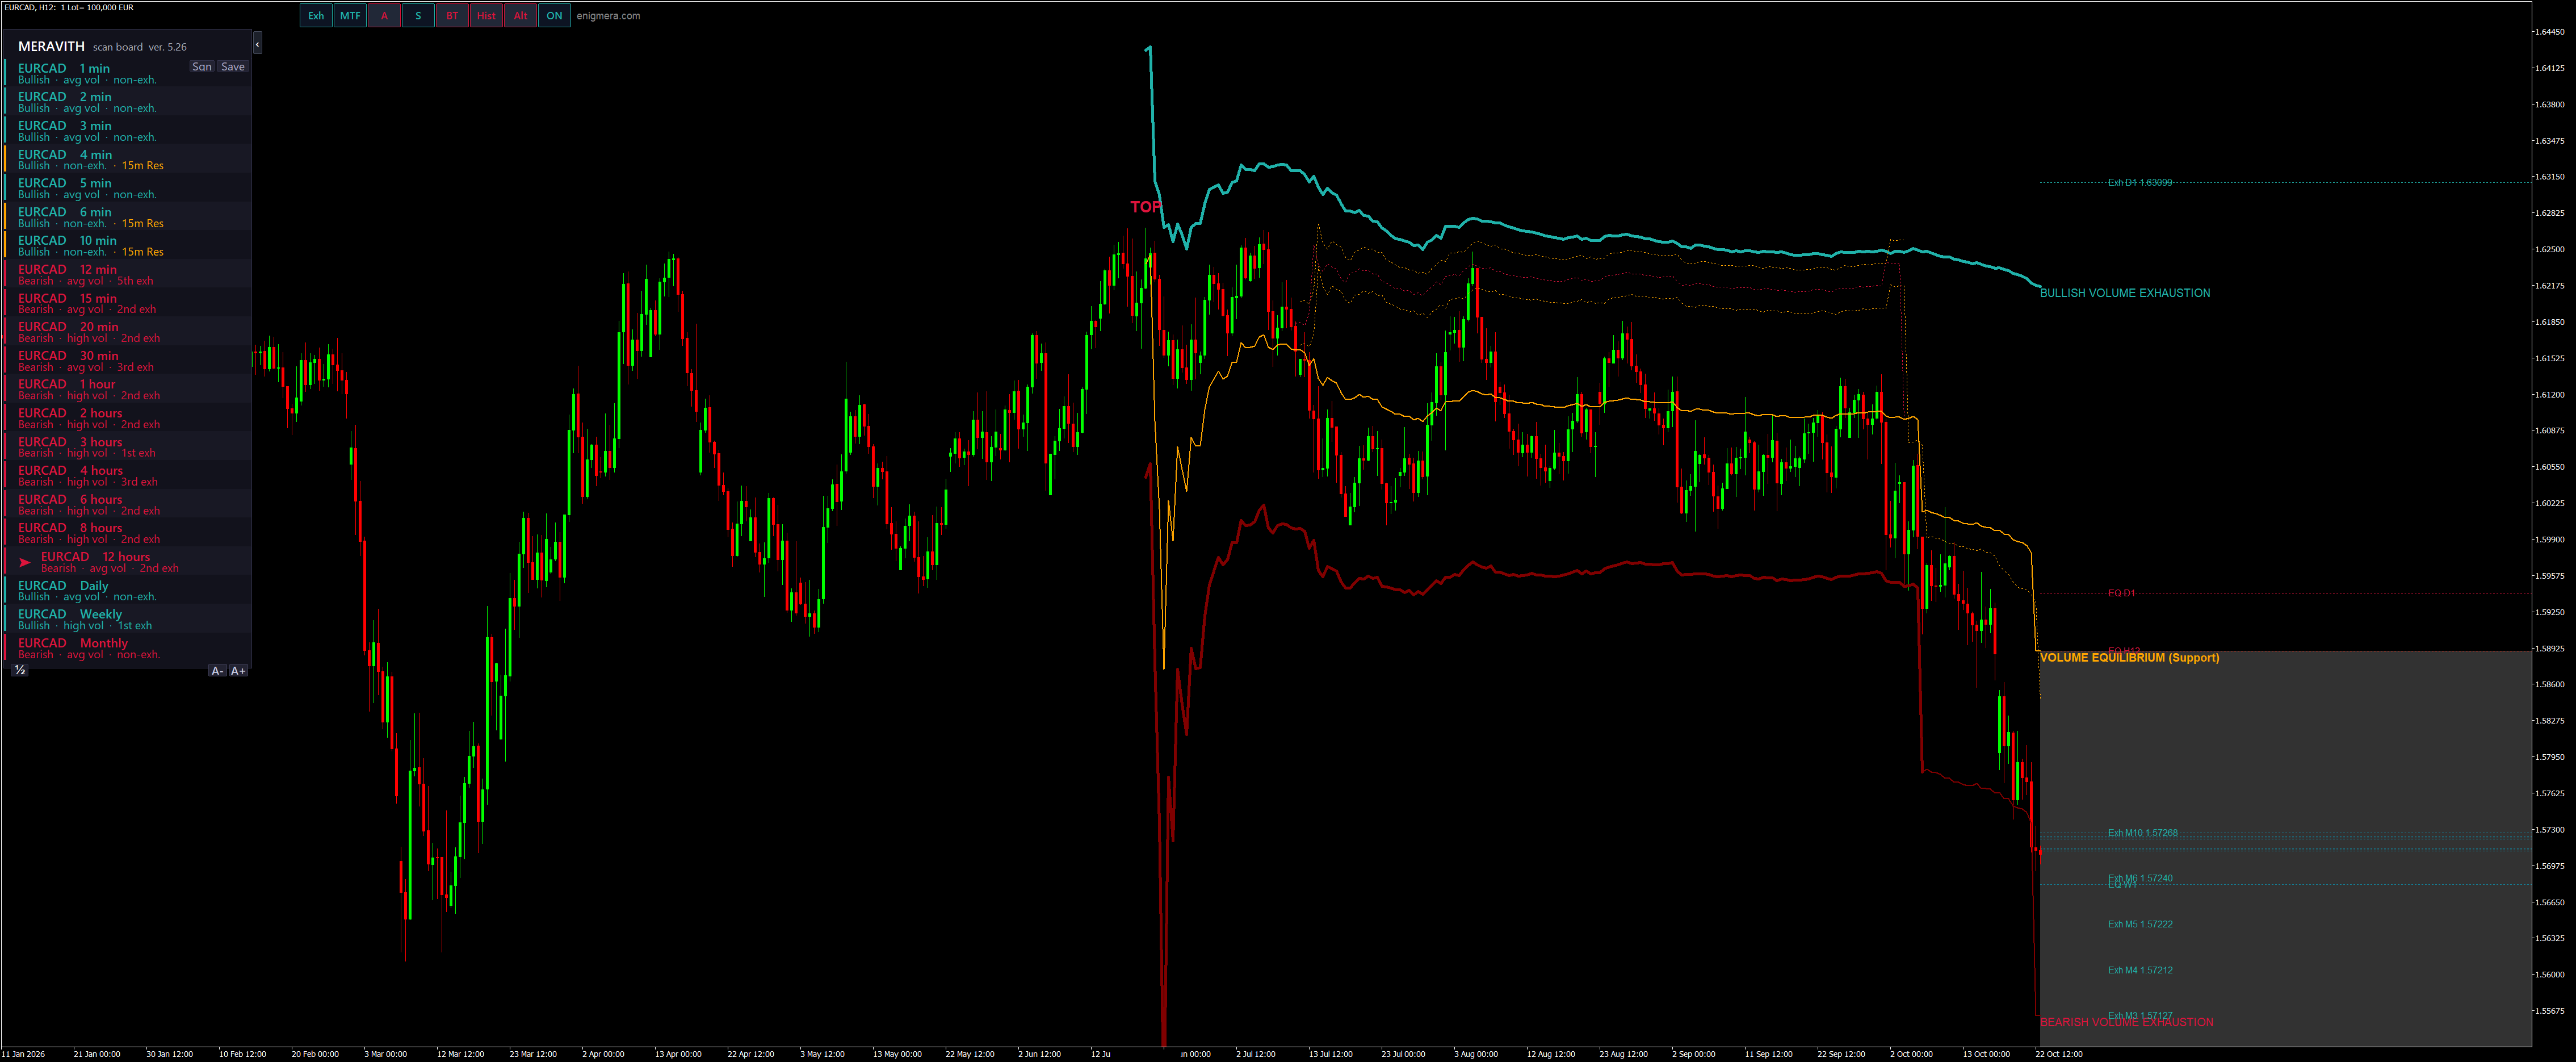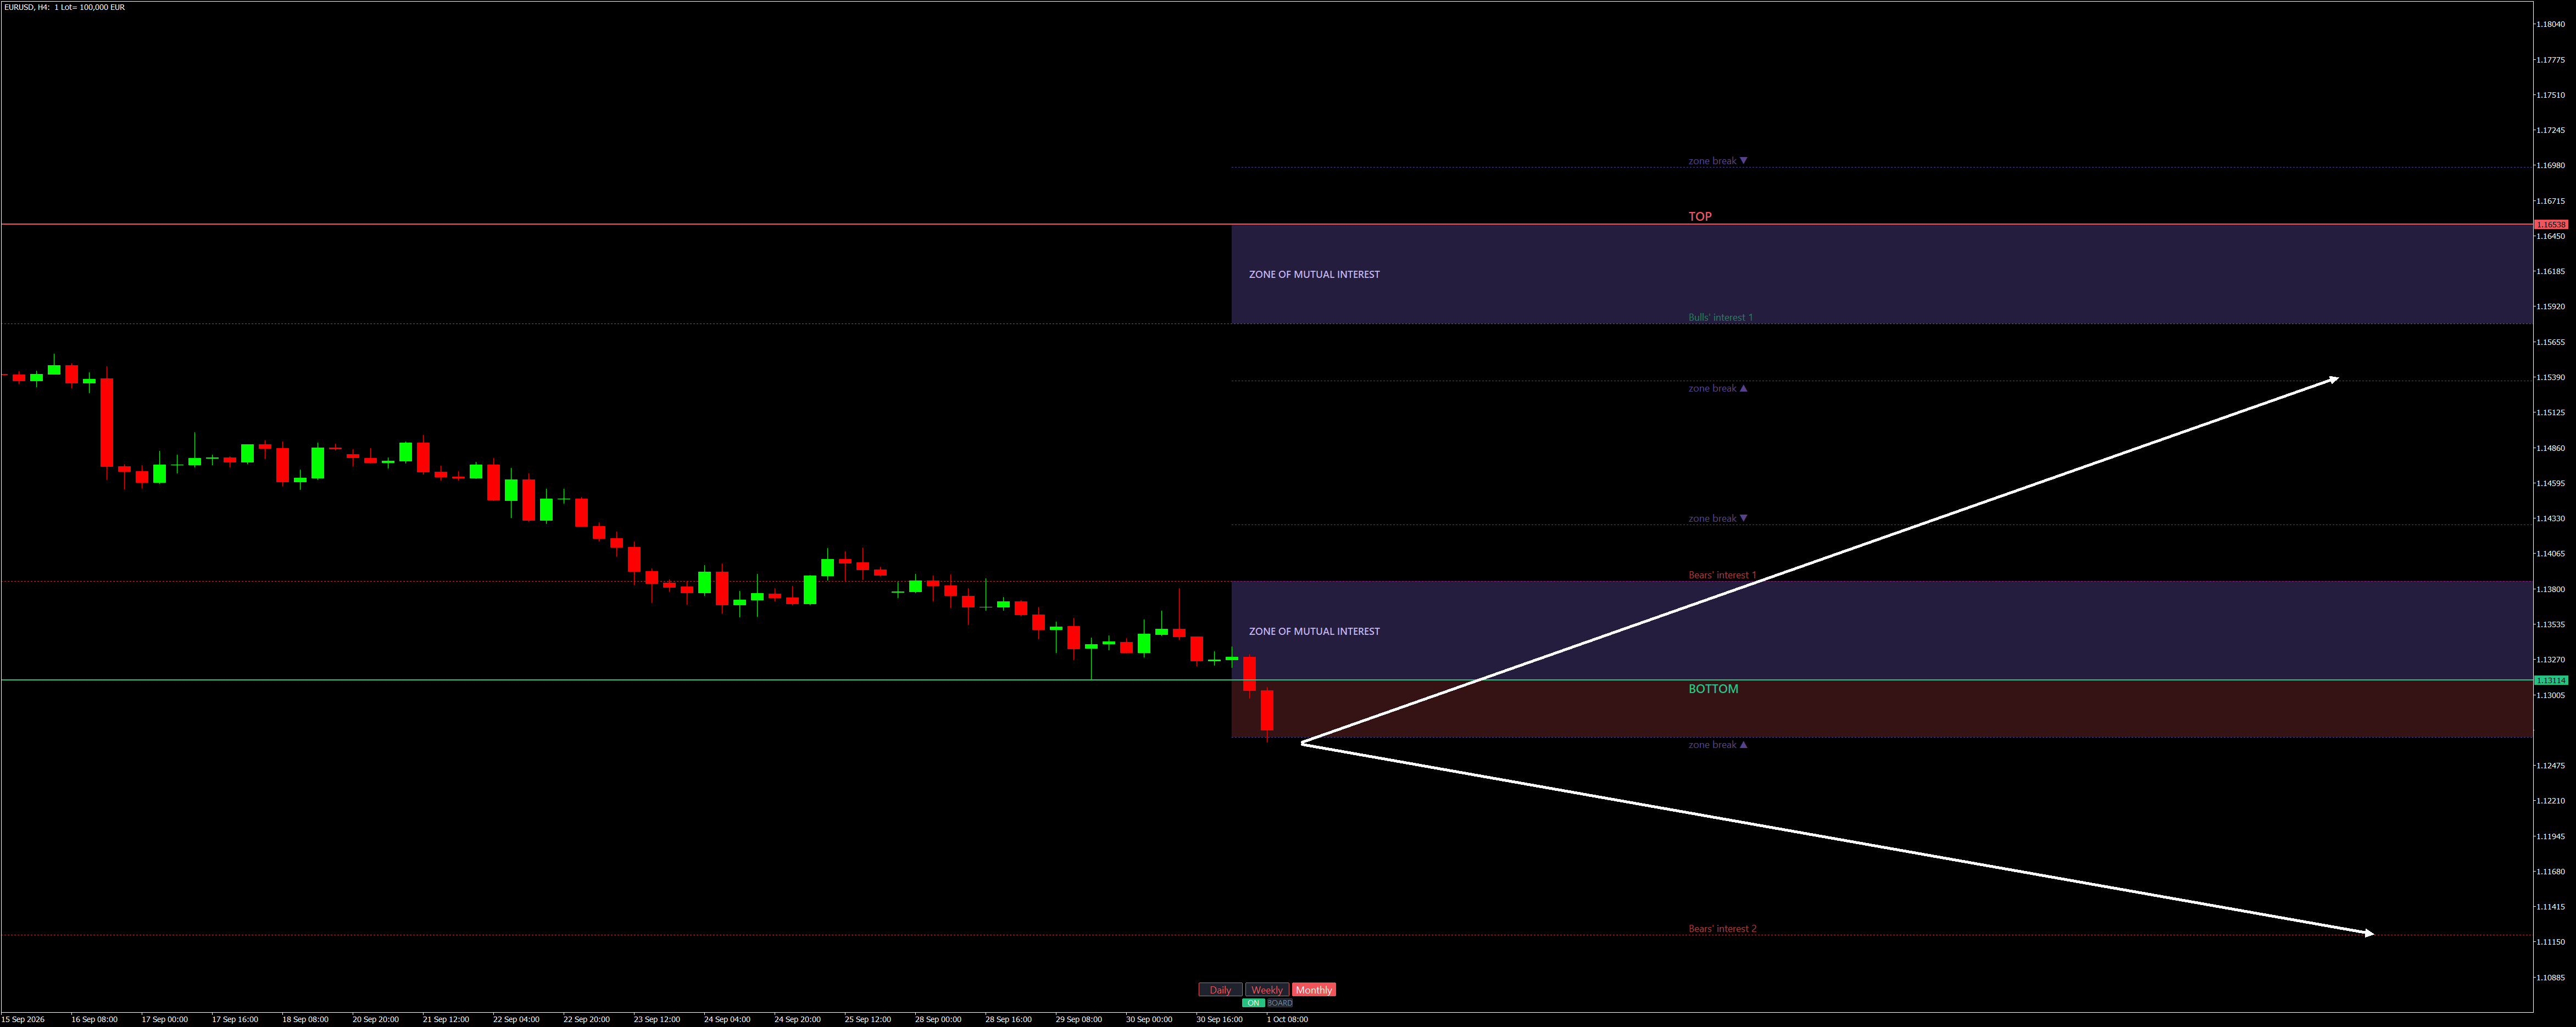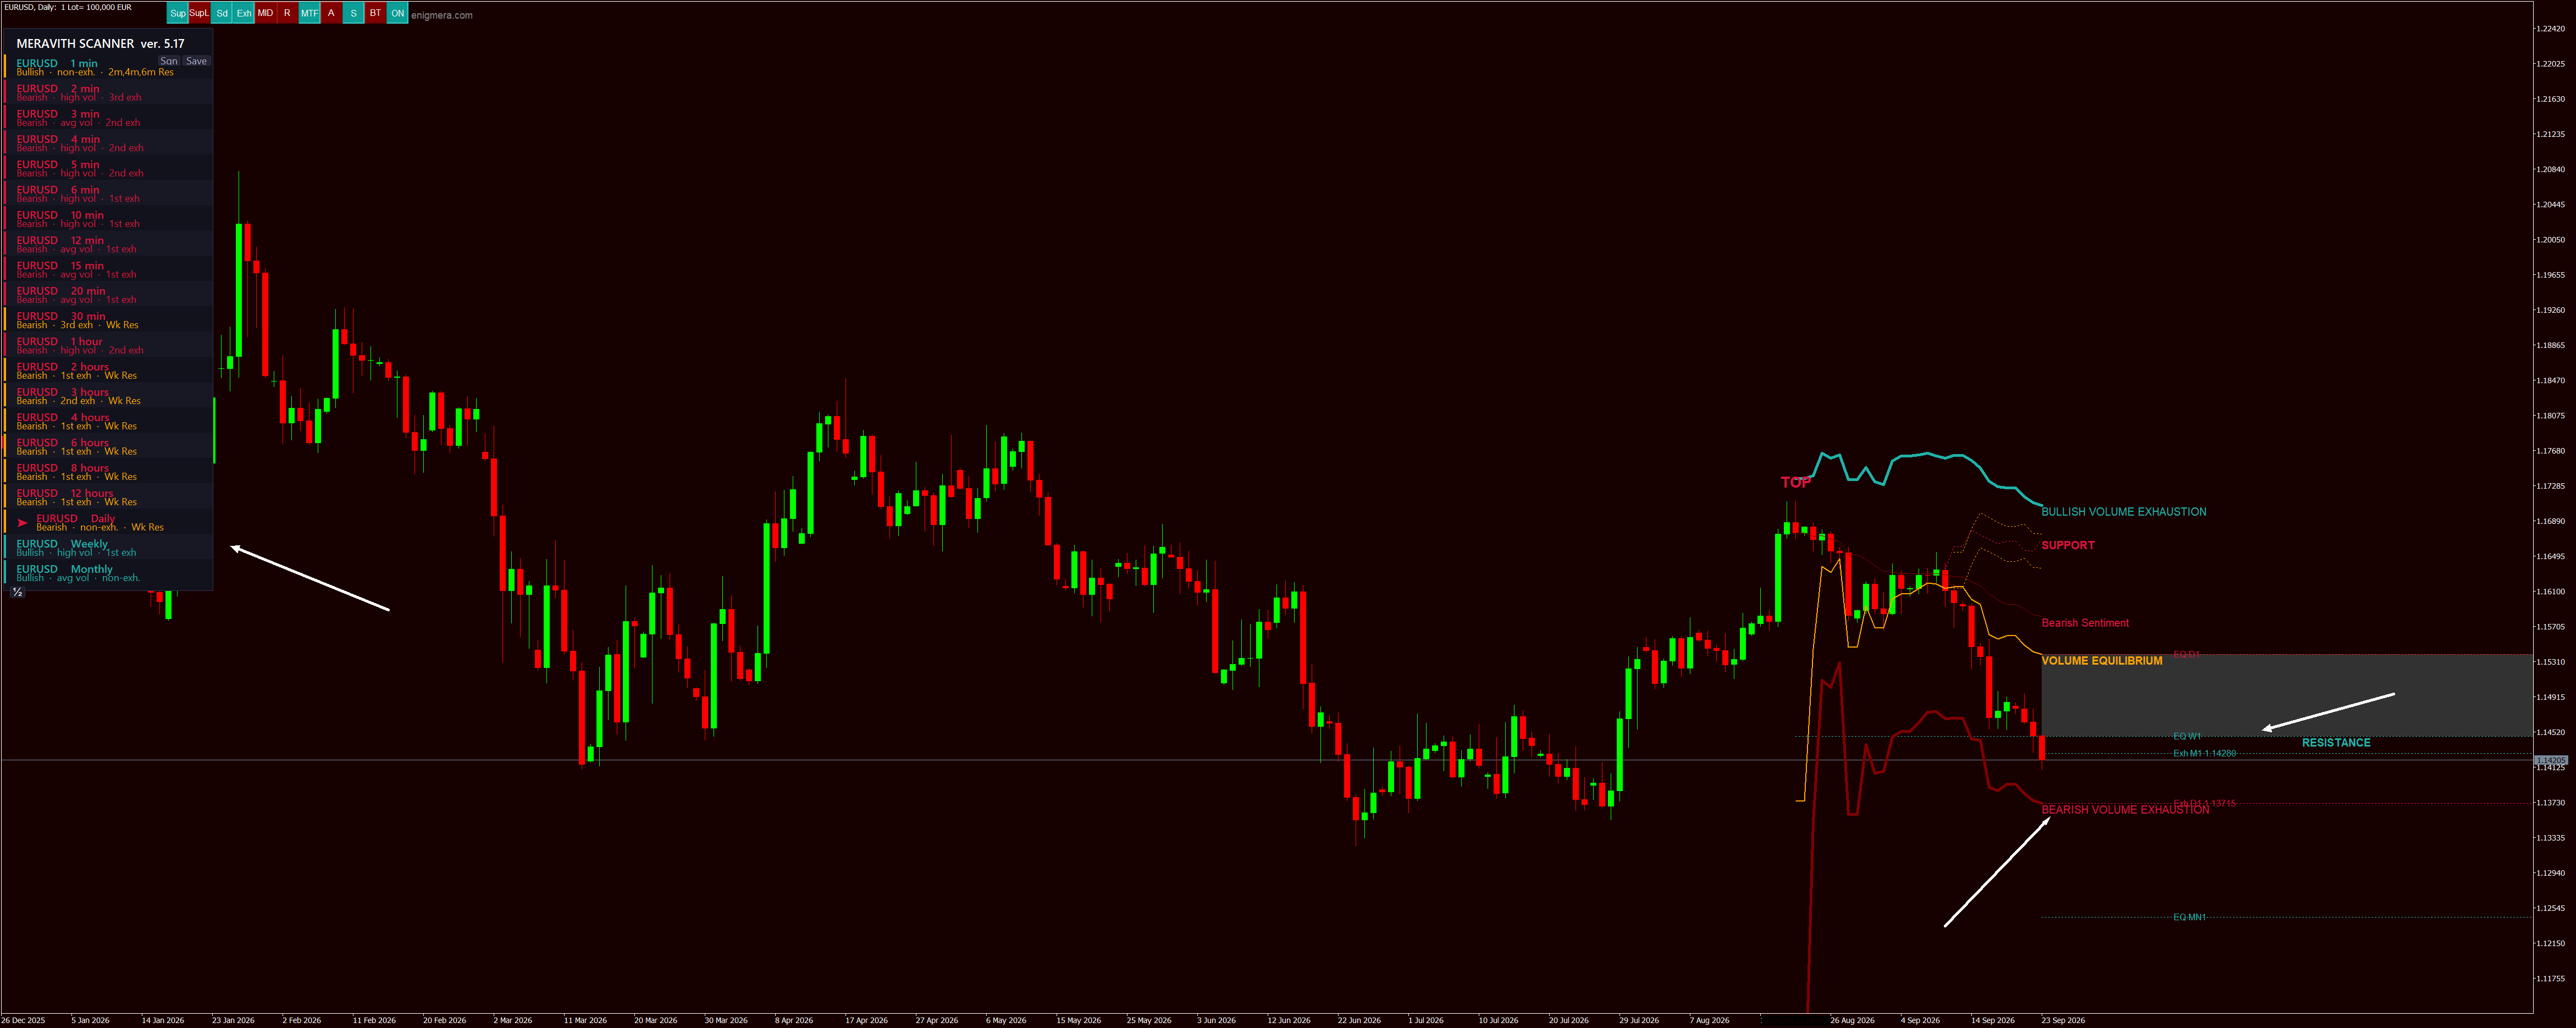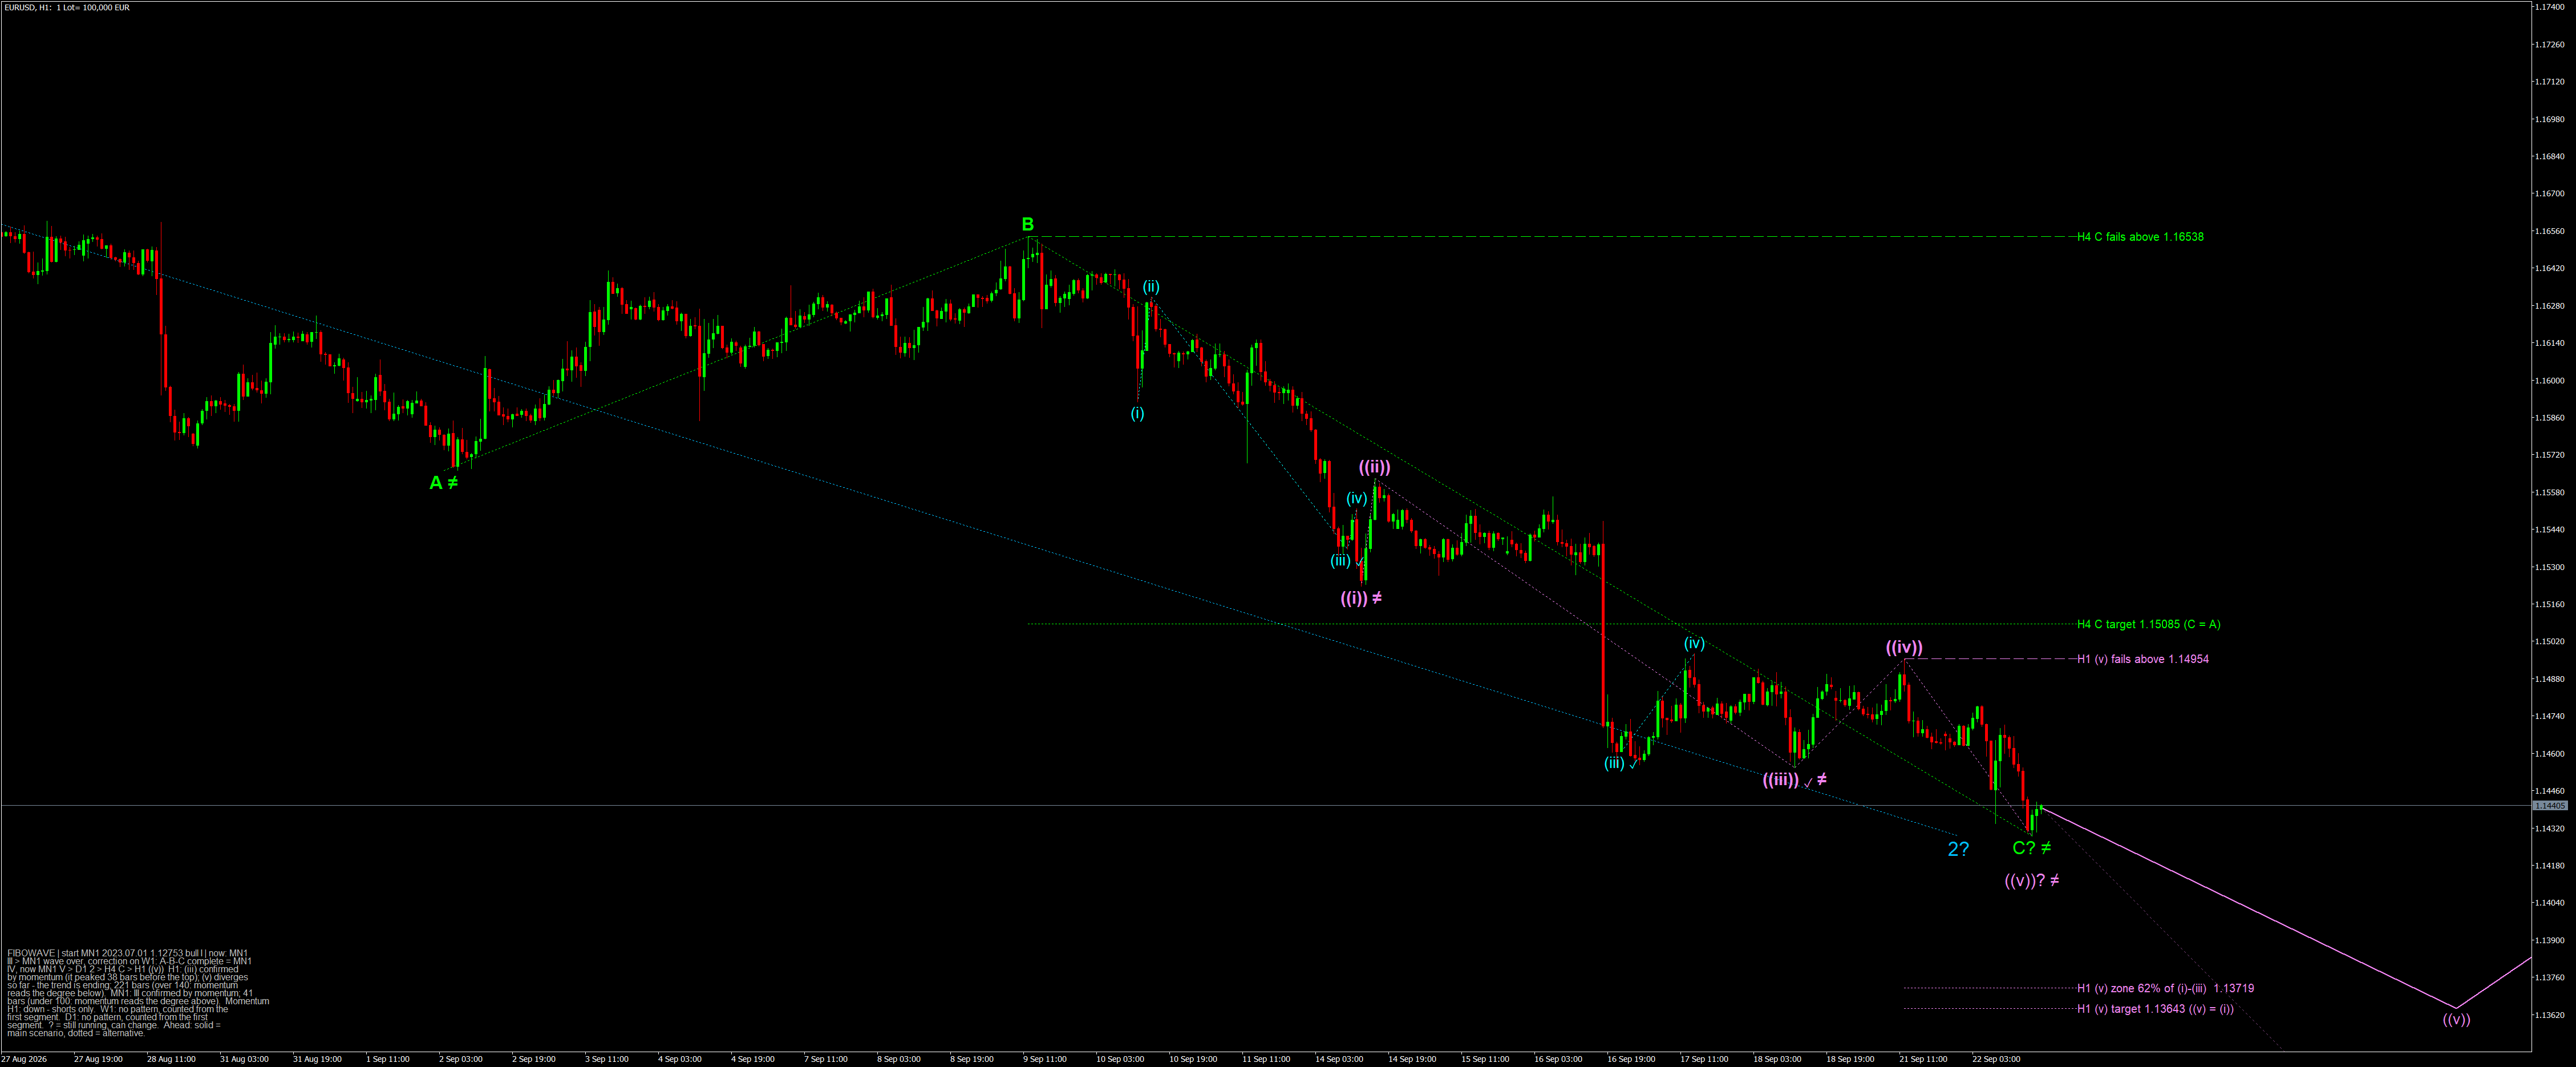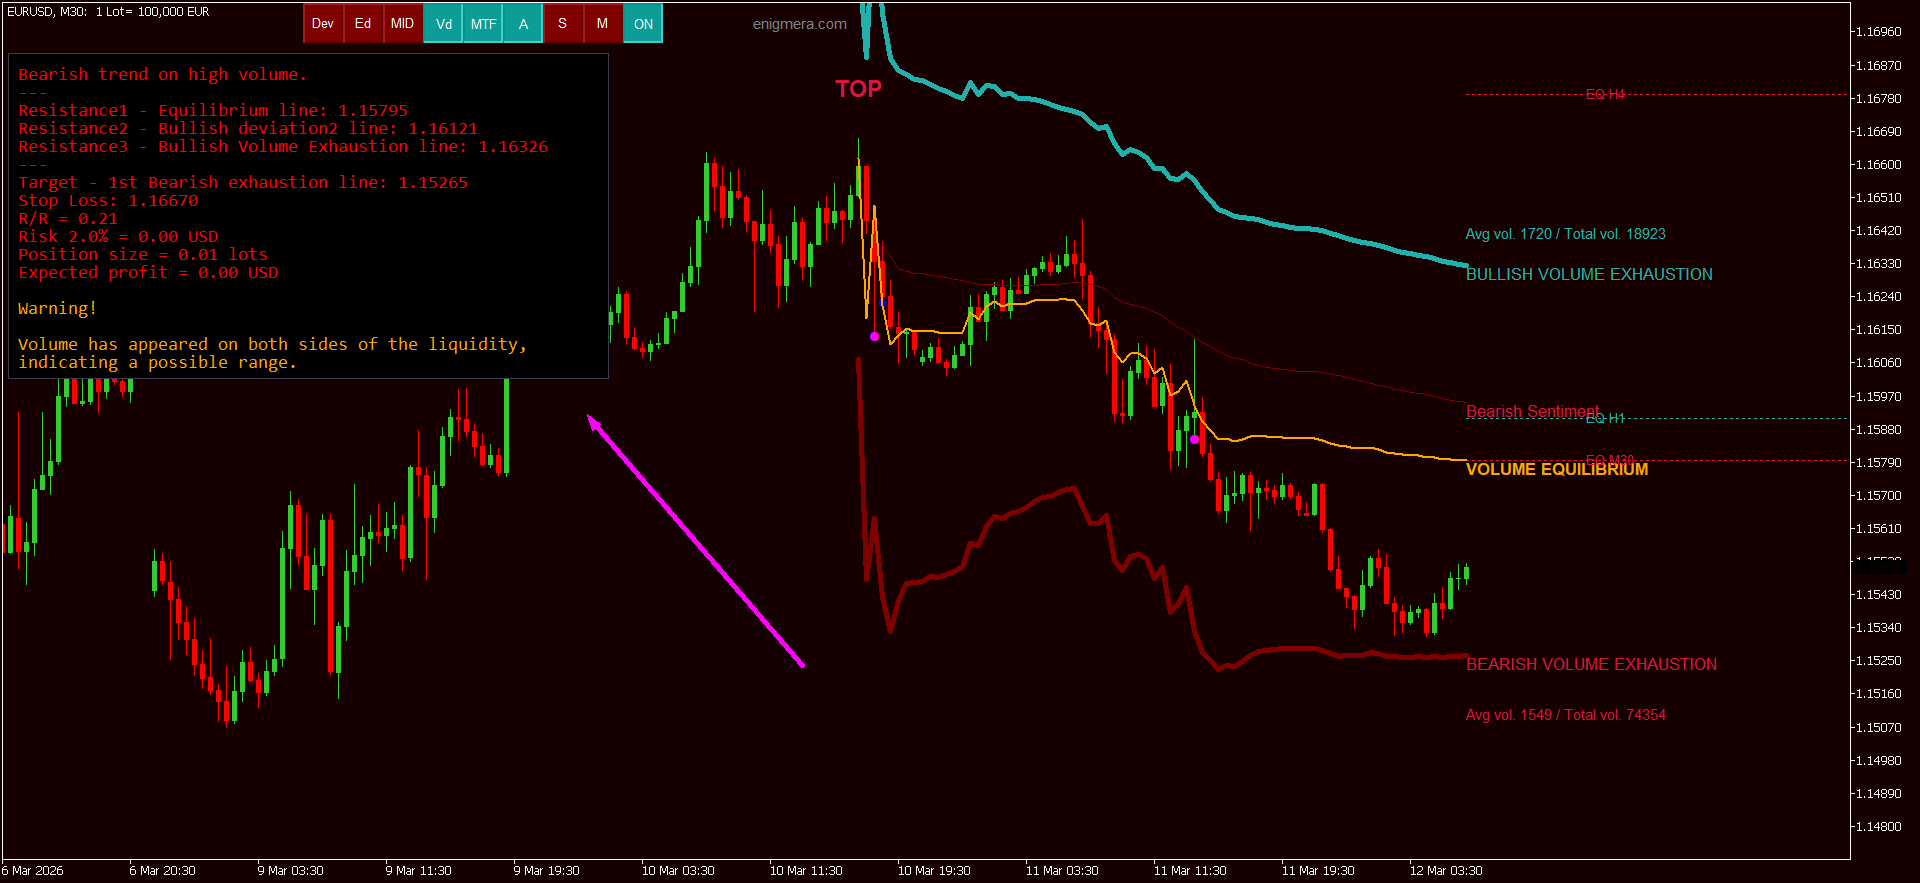
Every indicator reads the market through its past. Levels, volume, the start of the trend - all of it comes from the candles before today. As long as the market is the same market, that works.
Sometimes, though, the market changes overnight. A US election. A central bank turning its policy around. A shock like the Swiss franc in 2015. From that moment the big players decide by a new logic, and the old levels and the old volume clusters no longer tell the truth. The largest crashes come exactly then, because everyone keeps reading the market with data from a world that no longer exists.
MERAVITH reads the market through volume and through the first candle of the trend. If that first candle is from before the event, the whole reading is contaminated by the old regime.
The Market Reset solves this. You enter the date of the event, and from that date MERAVITH reads the market as if it began there. Before that date, for the indicator, there are no candles. The new candles show on their own where volume is building up in the new market.
The Market Reset is in MERAVITH 5.28, MERAVITH Scanner 2.21 and Enigmera Terminal 1.14.
How it works
One date per currency, not one date for everything. A US election is a change in the dollar. EURUSD has to start over; EURGBP has no reason to. That is why the inputs hold one date for each major currency: USD, EUR, GBP, JPY, CHF, CAD, AUD and NZD.
What the date applies to. The date of a currency applies to every instrument that currency is in. A currency is in an instrument when it is in the name, or when the instrument is quoted in it. The dollar's date therefore applies to EURUSD and USDJPY, but also to the US indices, US shares and gold, because they are quoted in dollars. An instrument with none of the dated currencies does not change in any way.
Two currencies with dates. When both currencies of a pair have a date, the later one counts. If the dollar is reset on November 4 and the New Zealand dollar on November 20, NZDUSD starts from November 20.
When a timeframe is ready. There is no warm-up period and no minimum number of candles. The rule is the rule of MERAVITH: there is a trend as soon as a candle breaks one side of the first candle after the reset. Until that happens, the timeframe has no trend, the board shows it as not read and the swarm does not count it. The minute charts find a trend within the first hour. The hourly charts within the first day. The daily after a few days. The weekly and the monthly when their candles form. All of this happens on its own, with nothing to set.
The red line. A red dashed vertical line stands on the chart exactly at the reset date of that instrument, so you always see where the reading begins. On an instrument the reset does not apply to, there is no line.
Enter it once
The dates are saved in a file shared by MERAVITH, MERAVITH Scanner and Enigmera Terminal. Enter the date in any of the three, on any one chart, and every other chart and product reads it by itself. Nothing has to be entered again when you change the chart or the timeframe.
The rules are simple:
- A date entered in the inputs is saved and applies everywhere.
- Zero in the inputs means "use the saved date".
- The setting ResetForgetSaved clears the saved dates and keeps only what is entered now.
The file is called MERAVITH_Reset.txt and sits in the MetaTrader Common folder (Terminal / Common / Files). It can be opened and edited with Notepad, one line per currency.
The Reset button
Sometimes you want to see how the market looks without the reset, on one chart, without touching the dates for everything else. That is what the Reset button is for.
- In MERAVITH and MERAVITH Scanner the button stands in the row of buttons, after Alt. In Enigmera Terminal it is in the Scan menu, as Reset.
- A lit button means the reset applies to the instrument on this chart. In the terminal the menu line also shows the date.
- One press switches the reset off for this chart only. The red line disappears, and the indicator and the S and M scans read the market over the whole history, as before.
- A second press brings the reset back.
- The dates in the file do not change. Every other chart keeps reading with the reset.
What the reset does not do
- It does not delete history. The old candles and the old zones are on the chart; they simply take no part in reading the trend. The large positions from before the event do not disappear, and price can still react to them.
- It does not decide by itself which event is fundamental. You set the date. There is no arguing with the machine about when the market changed.
- It changes no other rule of MERAVITH. The exhaustion levels, the equilibrium, the support and the volume dots are computed exactly as before - only from the new market onwards.
In short
- Enter the date of the event under its currency in the inputs, in any of the three products.
- A red line shows where the reading begins on every affected instrument.
- The timeframes switch on by themselves, one after another, as the new candles form a trend.
- The Reset button switches the reset off for one chart, without losing the dates.
- Instruments without an affected currency continue as before.