MT4 · MT5 · TradingView

The market leaves its levels behind.
These indicators find them.

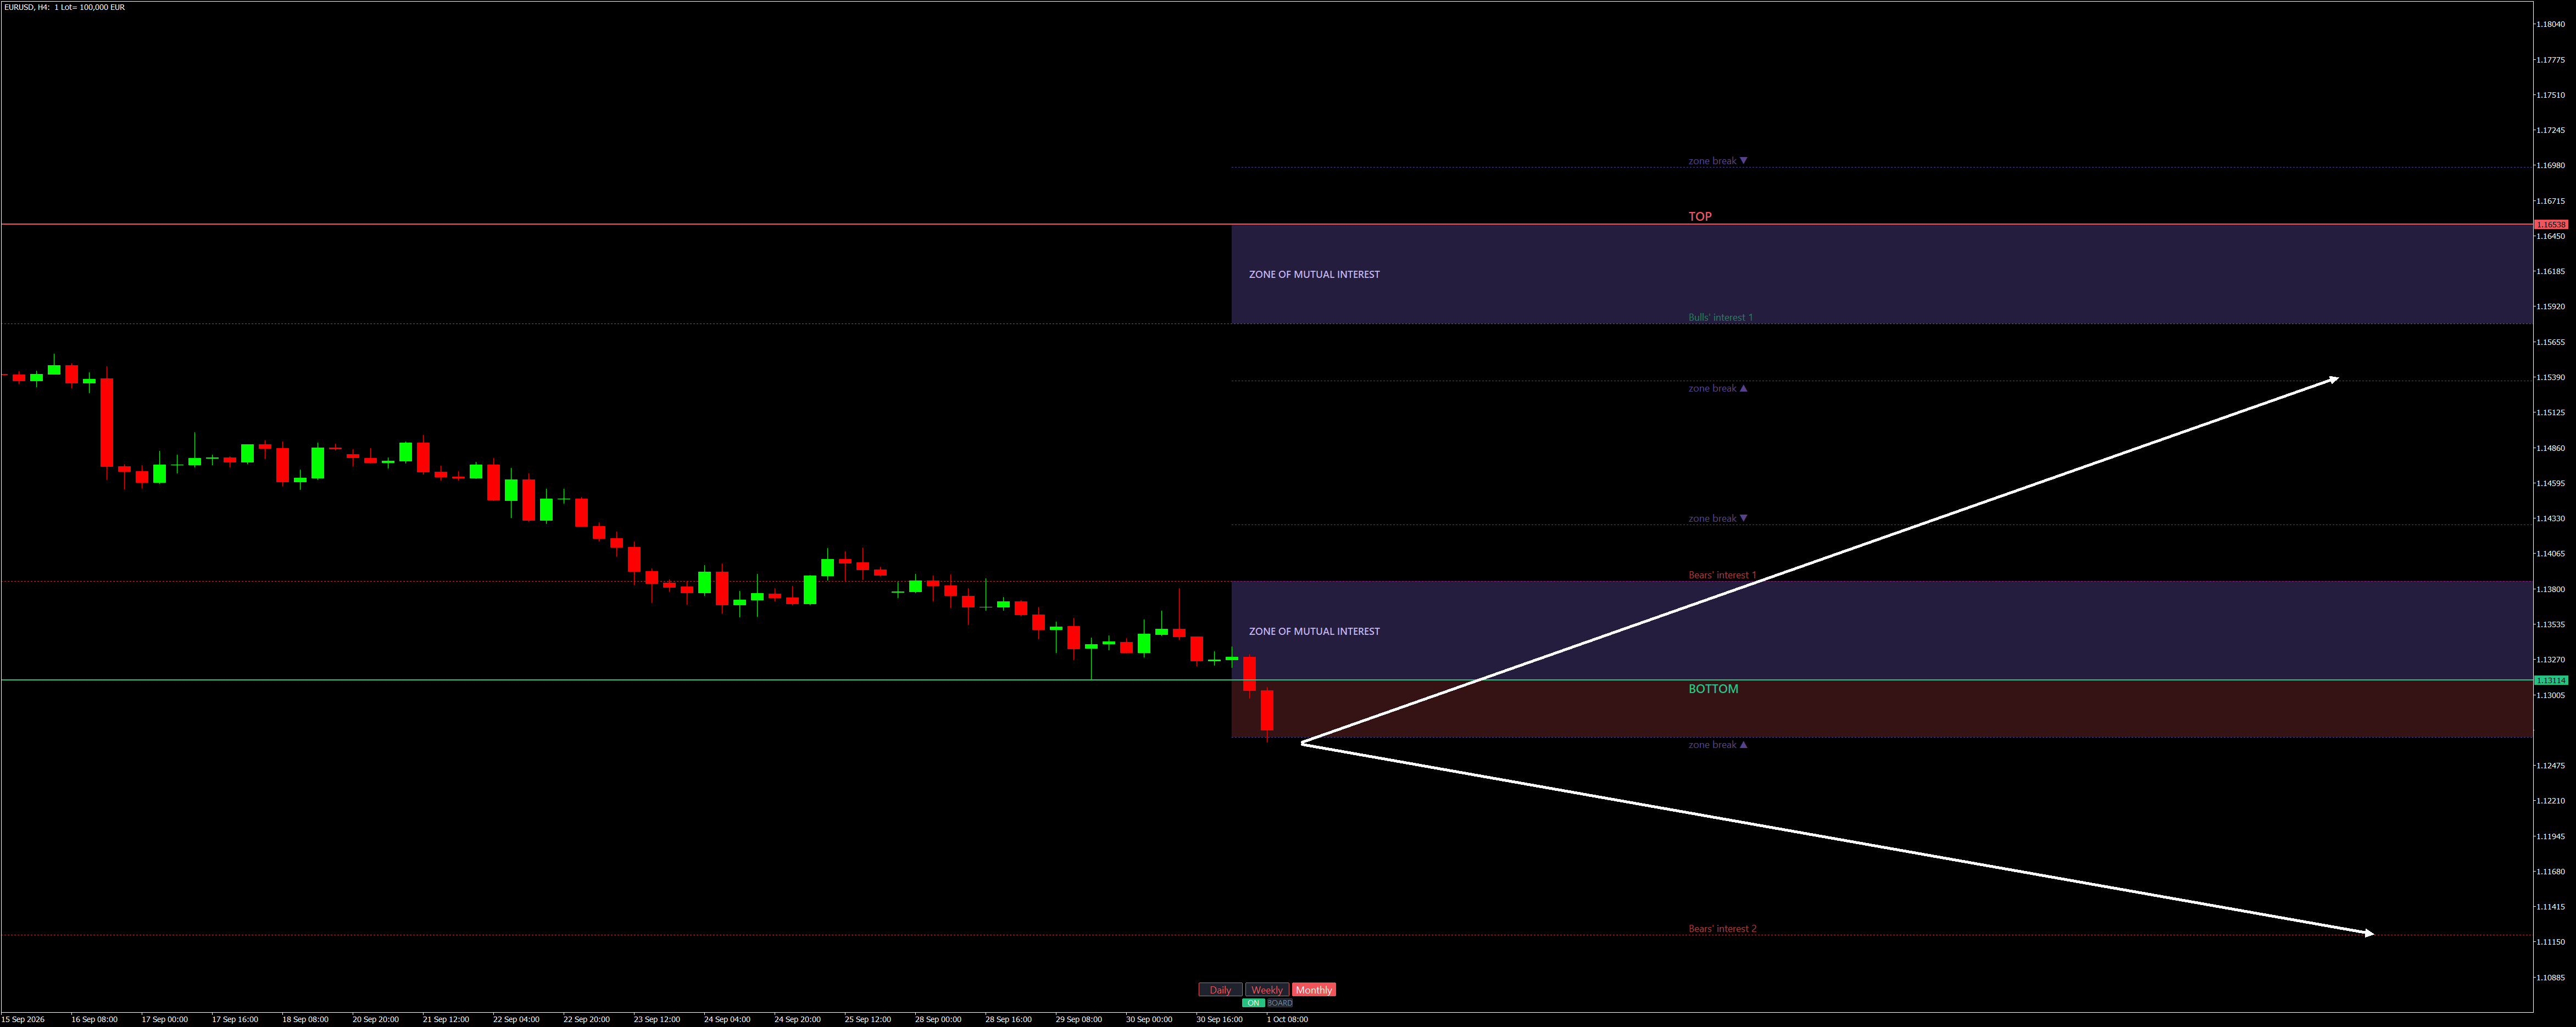
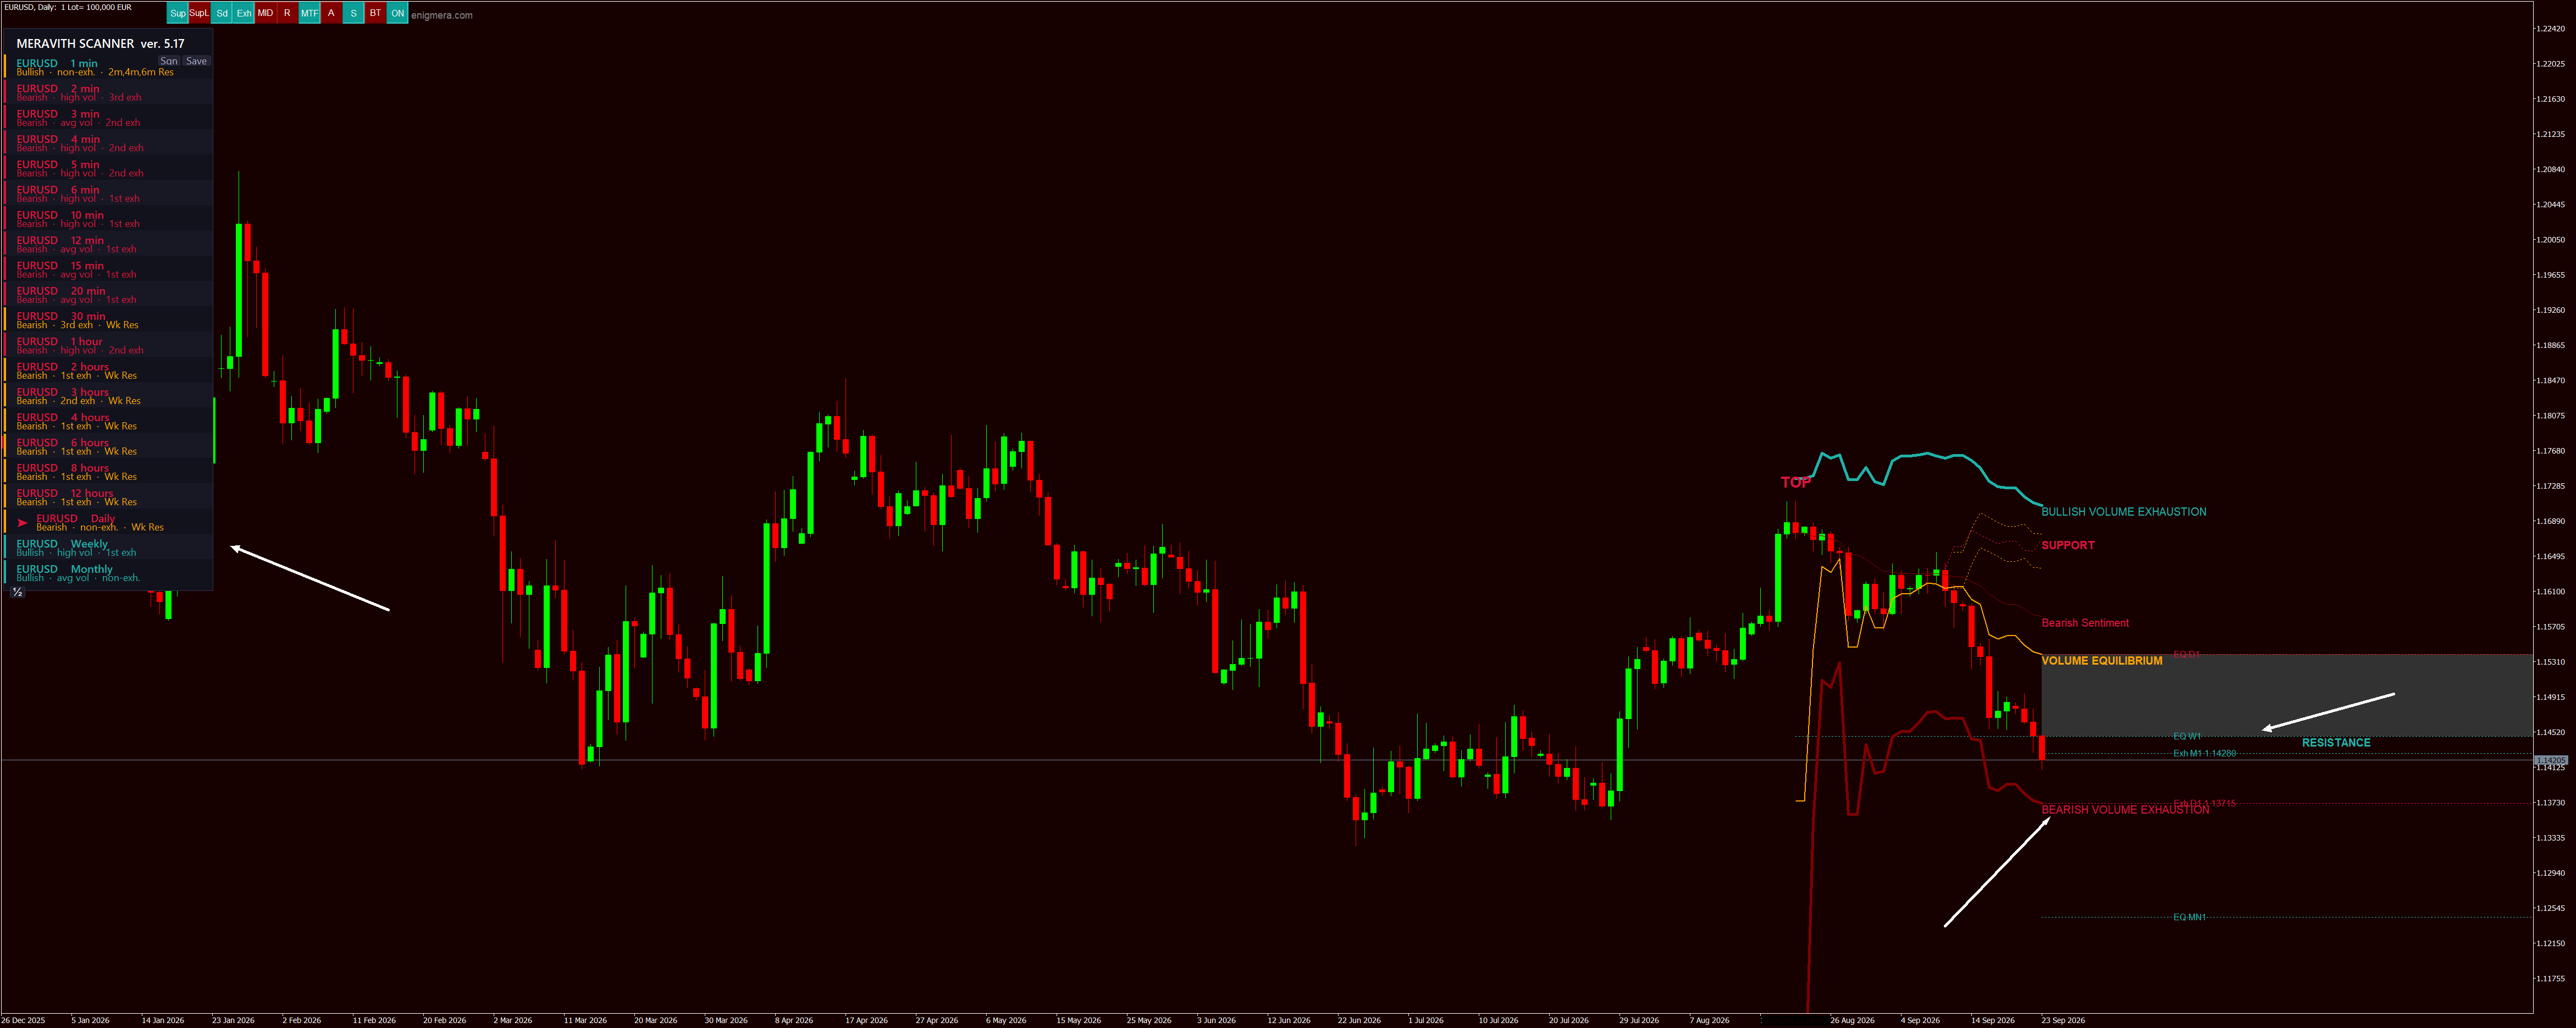
Review the market in full. MERAVITH shows you what is happening right now. It analyzes volume and price across every timeframe — from the lowest to the highest. It shows where financial interest is concentrated, where there is buying and where there is selling. This gives you market context — something ordinary indicators cannot provide.

  • Discover where price finds support
  • See where the indicator detects resistance
  • Check where trading volume runs out

Bought once, yours for good — or rented by the month. Written and supported by one developer, who answers.

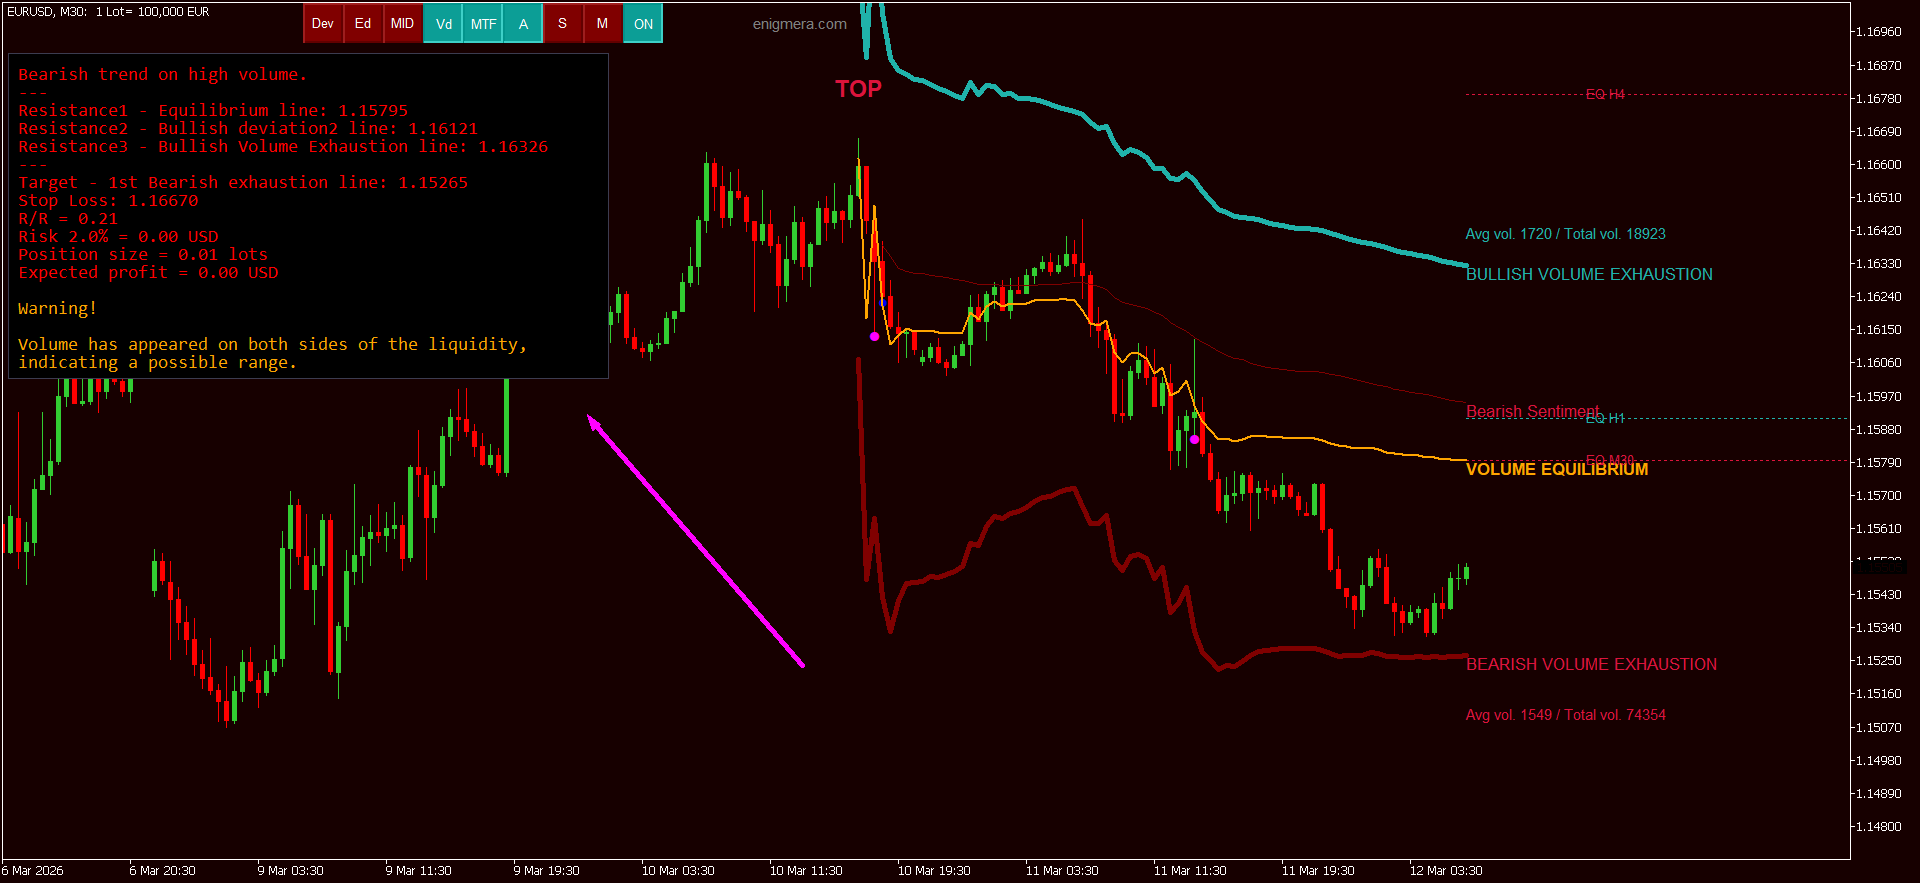
MERAVITH on EURUSD M30: the volume equilibrium line, both volume exhaustion levels, and the panel reading out resistances, target, stop loss and position size
MERAVITH on EURUSD M30 — and its own reading of what is on the chart
★★★★★

“By far, one of the best indicators I've ever bought. It's extremely accurate, and the support and attention from the creator are the best I've seen around here.”

Gabriel De Araujo Lobo · April 2026 · MQL5
★★★★★

“There is nothing else that can match this trading system. Finally something that makes sense and actually works. Ivan is kind and very helpful, he answers questions and gives good guidance.”

adrian100379 · July 2026 · MQL5
★★★★★

“The best system on the market. I recommend it with pleasure. He is happy to help you and works on improvements every day.”

Valeriu-alexandru Petrache · March 2026 · MQL5

Cuique pugnae sua instrumenta sunt

Today's Market Snapshot - 11 November 2026
Fresh market intelligence and trading notes, surfaced first.

Pourquoi il nous faut un vrai essai gratuit pour les utilitaires et les EA du Market : 5 raisons convaincantes qui vont tout changer

Raison n° 1 : le Strategy Tester n'est pas le vrai marché — et vos clients le savent !
Quand vos clients investissent dans un outil, ils veulent voir comment il se comporte vraiment en conditions réelles de marché. Le Strategy Tester ne peut pas reproduire les variables du réel comme les spreads changeants, le slippage ou les délais d'exécution en temps réel. Vos clients le savent — ils sont avertis, et ils veulent de vraies preuves de performance.

Raison n° 2 : les démos payantes tuent les ventes — les essais gratuits les font décoller !
Imaginez proposer un essai à 30 $ juste pour tester un produit pendant un mois. C'est une barrière qui fait fuir les acheteurs potentiels. Même un essai à 5 $ par jour peut sembler contraignant. Un vrai essai gratuit supprime totalement cette friction, permet aux utilisateurs de tester immédiatement, renforce la confiance et, au final, augmente les conversions.

Raison n° 3 : les essais gratuits génèrent un flot d'avis authentiques et de preuve sociale**
Quand tester est gratuit et facile, les clients s'impliquent davantage, laissent plus d'avis et partagent des retours honnêtes. Cela crée un marché transparent où les utilitaires de qualité se démarquent grâce à de vrais avis d'utilisateurs. Tout le monde y gagne : les développeurs sérieux obtiennent la visibilité qu'ils méritent, et les acheteurs font des choix éclairés.

Raison n° 4 : dites adieu aux backtests trompeurs et aux données confuses
Tous les utilisateurs ne sont pas experts en backtesting. En réalité, beaucoup ne savent pas le faire correctement. Si les données de leur broker sont incomplètes, le Strategy Tester peut produire des résultats fantaisistes. Un essai gratuit en réel leur permet de voir la performance véritable sur leur propre compte, ce qui supprime la confusion et bâtit la confiance.

Raison n° 5 : la vraie confiance est transparente — et la transparence fait vendre
Si vous croyez en votre produit, laissez-le parler de lui-même. Proposer un essai gratuit montre de la confiance et de l'intégrité. Comme on le dit souvent dans la communauté : « Ceux qui n'ont pas peur de leurs propres produits n'ont rien à cacher. »
C'est un message marketing puissant qui vous distingue de la concurrence.

---

Conclusion : faites de l'essai gratuit votre avantage concurrentiel
Adopter un vrai modèle d'essai gratuit n'est pas qu'une commodité — c'est un choix stratégique qui peut transformer votre réussite sur le marketplace.
Prêt à voir la différence ? Proposez un essai gratuit et regardez la crédibilité et les ventes de votre produit s'envoler !
Share post:
Facebook X LinkedIn Telegram WhatsApp
Markets today MERAVITH · D1
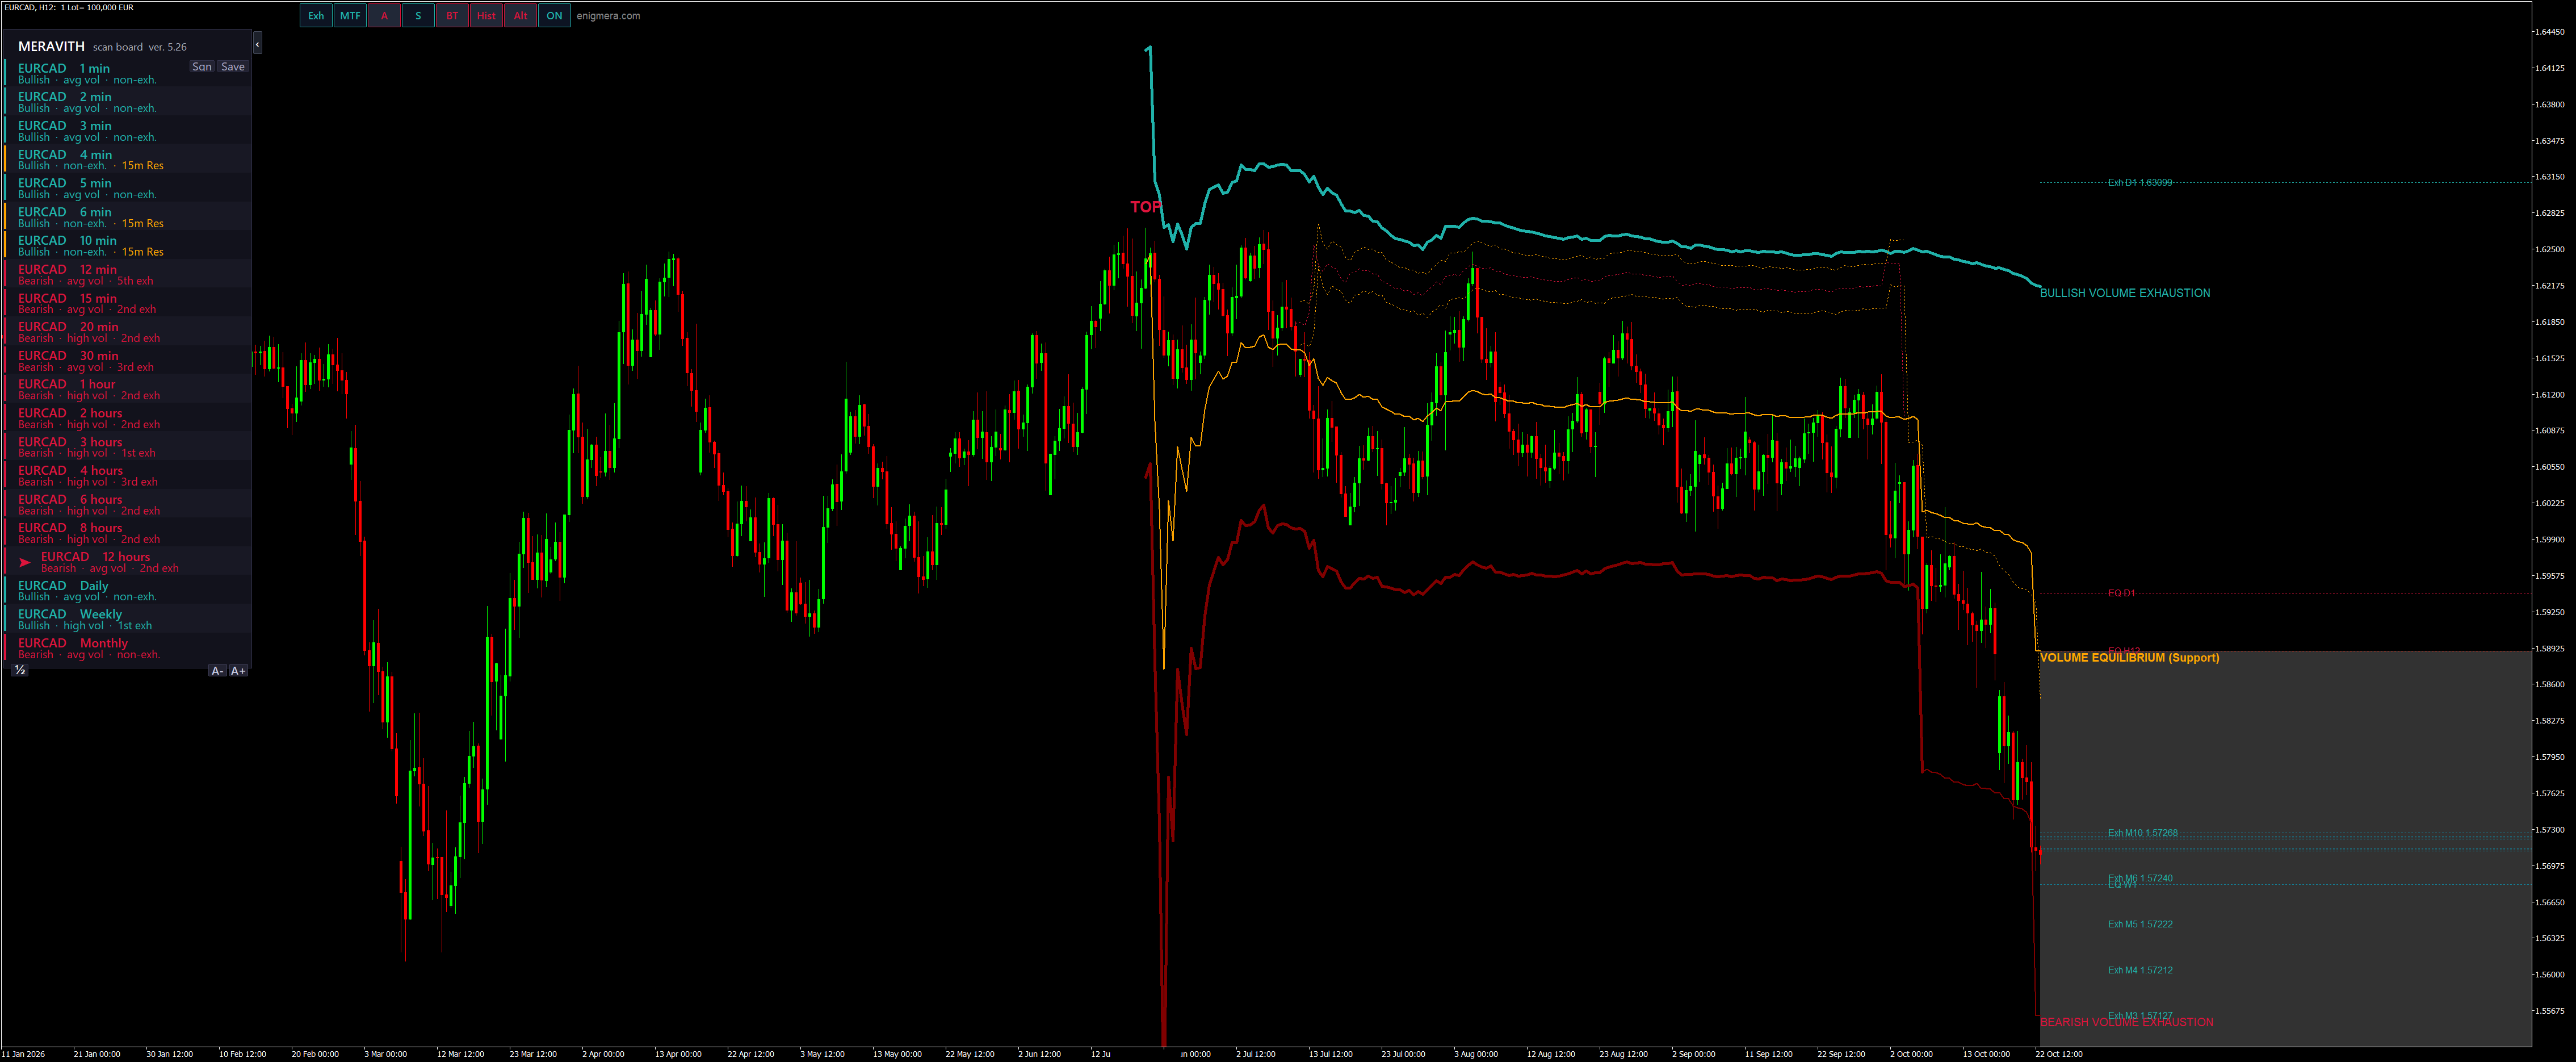
Today's trading example EURCAD
One EURCAD trade, from the scan to the exit
The scan, the exhausted cluster, the entry with Alt and the exit at the higher resistances.
Watch on YouTube

MERAVITH on the daily chart, last closed day: 05.11.2026 · Not investment advice.

Journal

Trading Far from Fair Value vs. Trend Trading

There are two main ways to trade the market. The first follows the trend and relies on the move continuing. The second trades the return of price to its fair value and relies on the move having gone too far. This article explains why tradin…
Read full post

Need a target? Think about this!

The Target Question: A Matter of Logic Logic first The most important thing in trading is logic. When we apply logic, we achieve results. This article asks one logical question to every reader. There is no ready answer here. Each reader is …
Read full post

Context Is King

How Trading Indicators Really Work Trading indicators do not predict the market. They interpret market data through the algorithms built into them. An indicator does not truly know whether the market is bullish or bearish. It simply display…
Read full post
Page 1 of 3
Analysis
EUR/CAD: a buy after an exhausted bearish Swarm

EUR/CAD: a buy after an exhausted bearish Swarm NEW

1. What the scan shows After a MERAVITH scan, EURCAD shows a run of timeframes from M12 to H12 that are all bearish, and every one of these bearish trends is already exhausted. We call such a group a Swarm: neighbouring timeframes that move in the same direction and have all reac…
Read analysis
What I traded today

What I traded today

One EURCAD trade, from the scan to the exit This is a real trade, read step by step with MERAVITH. 1. The scan. We started by scanning EURCAD on every timeframe, from one minute to one month. One thing stood out at once: from M30 up to H12, eight timeframes in a row were bearish.…
Read analysis
Page 1 of 7
Post Chat Public conversation between users
Loading chat...
Be respectful and stay on topic.