Trading indicators do not predict the market. They interpret market data through the algorithms built into them.
An indicator does not truly know whether the market is bullish or bearish. It simply displays bullish or bearish conditions when its algorithm calculates them. This is a crucial point to understand.
Imagine the market is in a bearish trend, but you have not analyzed it properly. You look at an indicator, and it gives you a buy signal near the top of a correction. Because you do not know that this move is only a bullish correction inside a larger bearish trend, you buy. Then the indicator reverses, the market continues downward, and you lose money.
Naturally, many traders blame the indicator.
But in reality, the problem is not the indicator. The problem is the lack of market analysis before using it. You did not define the trend, the timeframe, the key support and resistance levels, the stop areas, or the logical targets of that trend.
No matter which indicator you use, if you simply apply it to a chart and wait for results, you will almost always lose money. I can say this with complete confidence.
The indicator does not think. You do.
The indicator does not replace you. It helps you.
This means that first, we define the market context. Only after that do we use indicators.
What Is Market Context?
Market context is the most important part of trading.
To understand context, you must first define which part of the market you are analyzing.
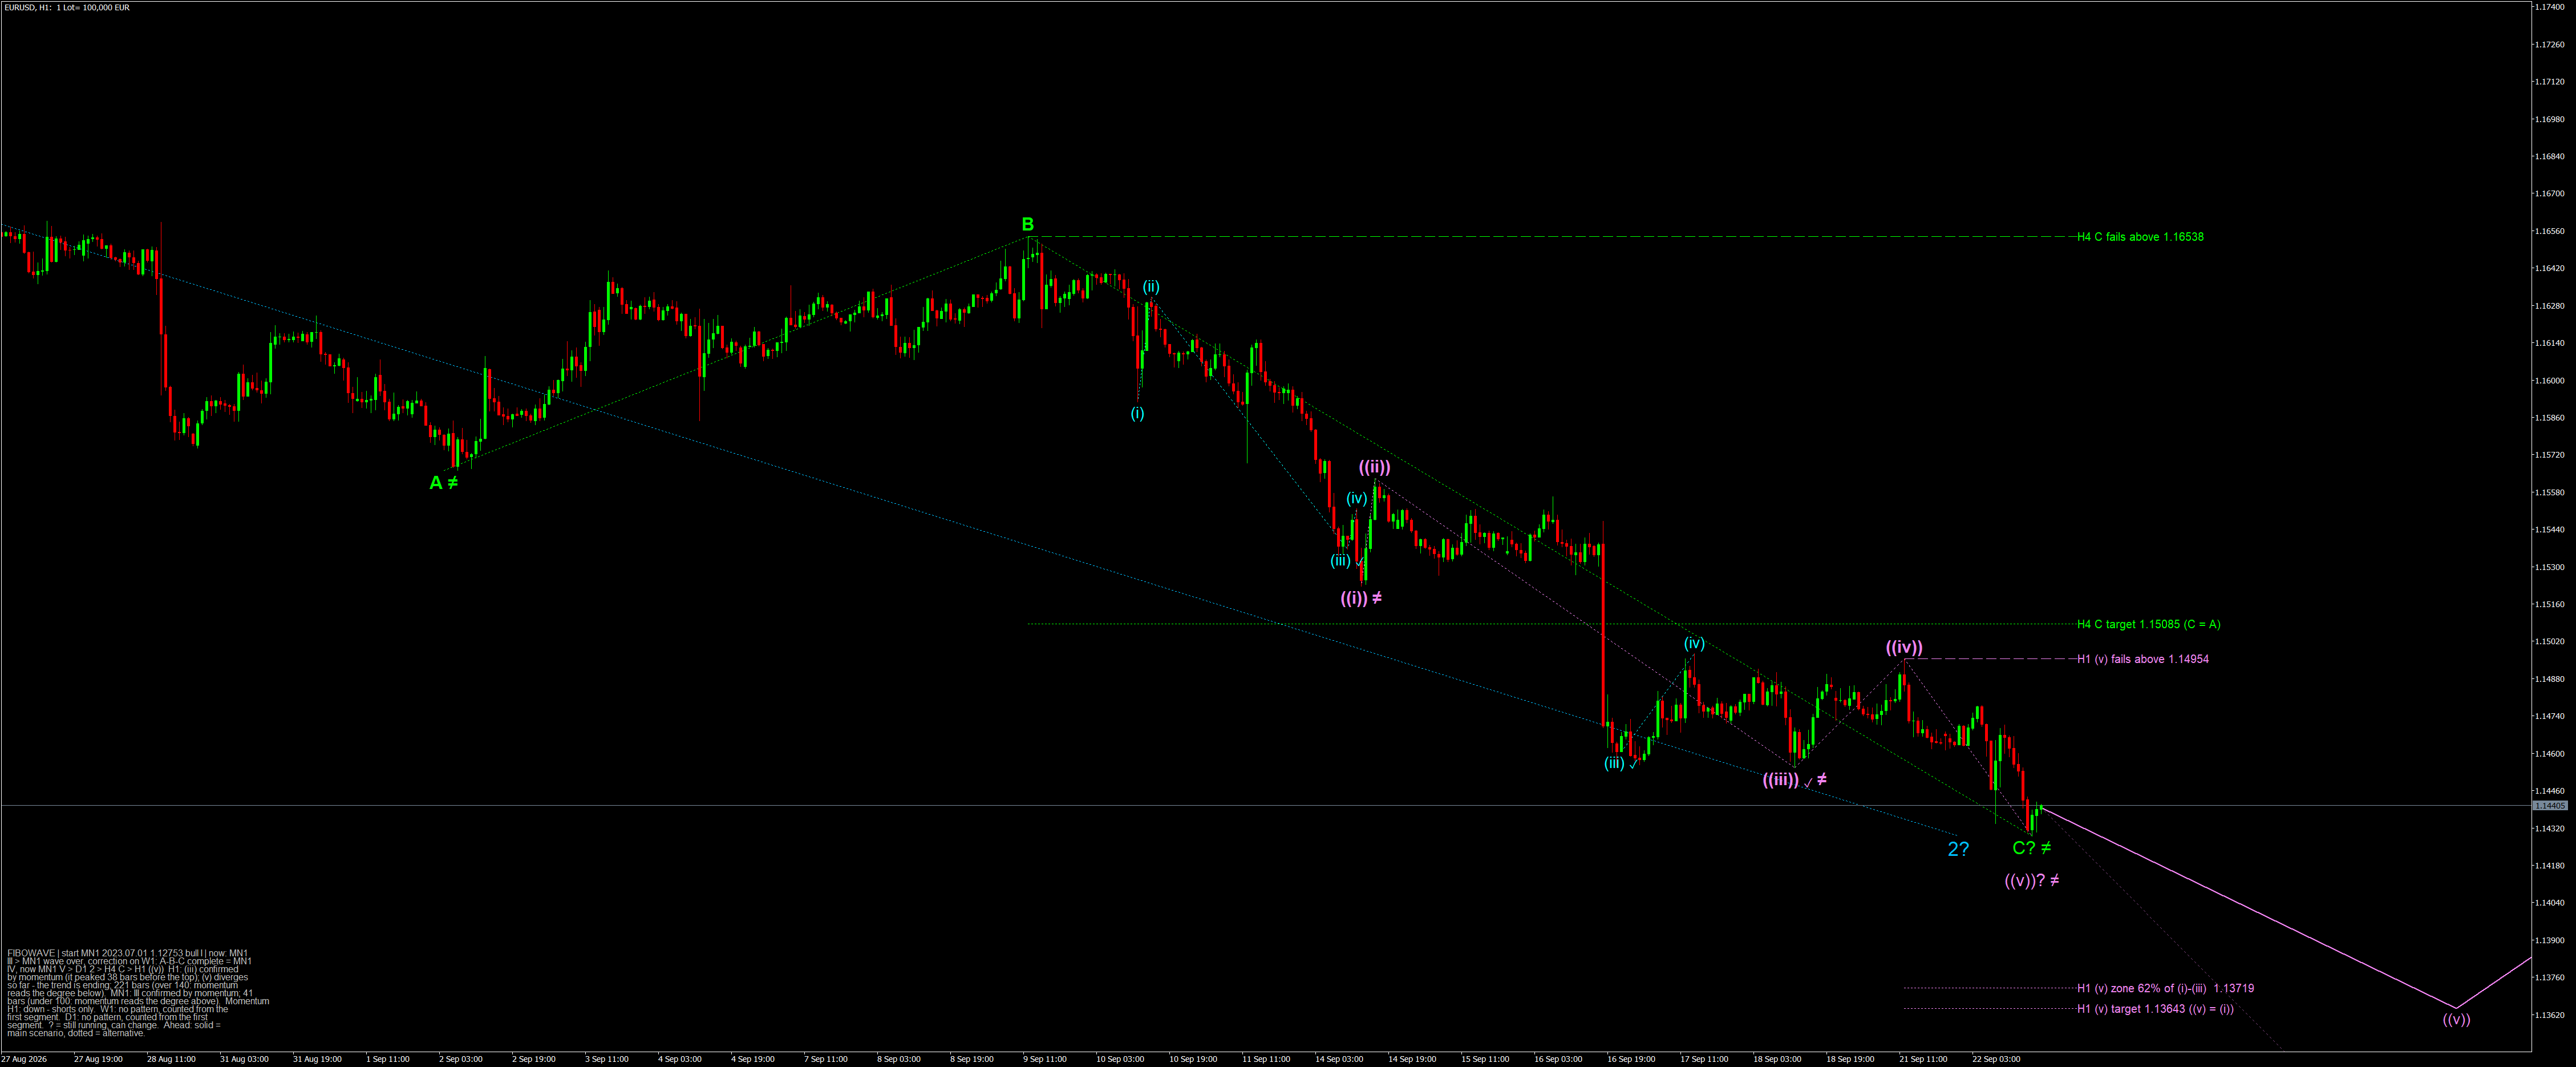
For example, if you look at the market from January 1st to September 1st, the market may appear bullish because price has been rising during that period.
But if you look only from July 1st to September 1st, the same market may appear bearish because price has been falling.
So which one is correct?
The answer depends on the context.
Which part of the market are you actually analyzing? And more importantly, why are you analyzing it from that specific starting point?
For example, you may say:
“I am analyzing the market from this point because the previous trend ended there and a new trend began.”
That is a clear rule.
A trend remains valid if the previous trend has ended and the current trend has not broken its support.
Again, this is a clear rule.
If you cannot define the market using clean, logical rules, then you do not have context. And if you do not have context, you are applying indicators without truly knowing why.
The Problem With Indicator Targets
The next important question is:
Where should I close my position?
If you do not have market context, you simply wait for the indicator to tell you. This is where many traders become dependent on indicators with arrows and targets: Target 1, Target 2, Target 3.
But market targets are extremely subjective.
When you use an indicator, do you actually know how the programmer calculated those targets?
Most of the time, you do not.
One programmer may think:
“If price moved 100 pips yesterday and the market is bullish, then today I expect another 100 pips.”
So the programmer divides those 100 pips into three parts and creates Target 1, Target 2, and Target 3.
Is this correct?
We do not know. It is simply a logic built into the indicator as an algorithm.
Another programmer may think:
“If price has risen for three consecutive days, I expect a top and a reversal.”
Is that always logical?
Not necessarily. But it may still be part of the indicator’s algorithm. So the indicator creates Target 1, Target 2, and Target 3 in the opposite direction of the trend.
Is this correct?
Again, we do not know. It is just another algorithmic interpretation of the market.
A third programmer may think:
“If price is above the 50-period and 200-period moving averages, the market is bullish. If price is below them, the market is bearish.”
Then that programmer also builds targets based on this logic.
Is this correct?
We still do not know. It is simply a rule inside the indicator.
And so on.
The more complex the logic is, and the more market elements it takes into account, the lower the chance that the indicator will mislead you. But even then, it is still an algorithm.
The Difference Between an Indicator and a Context Machine
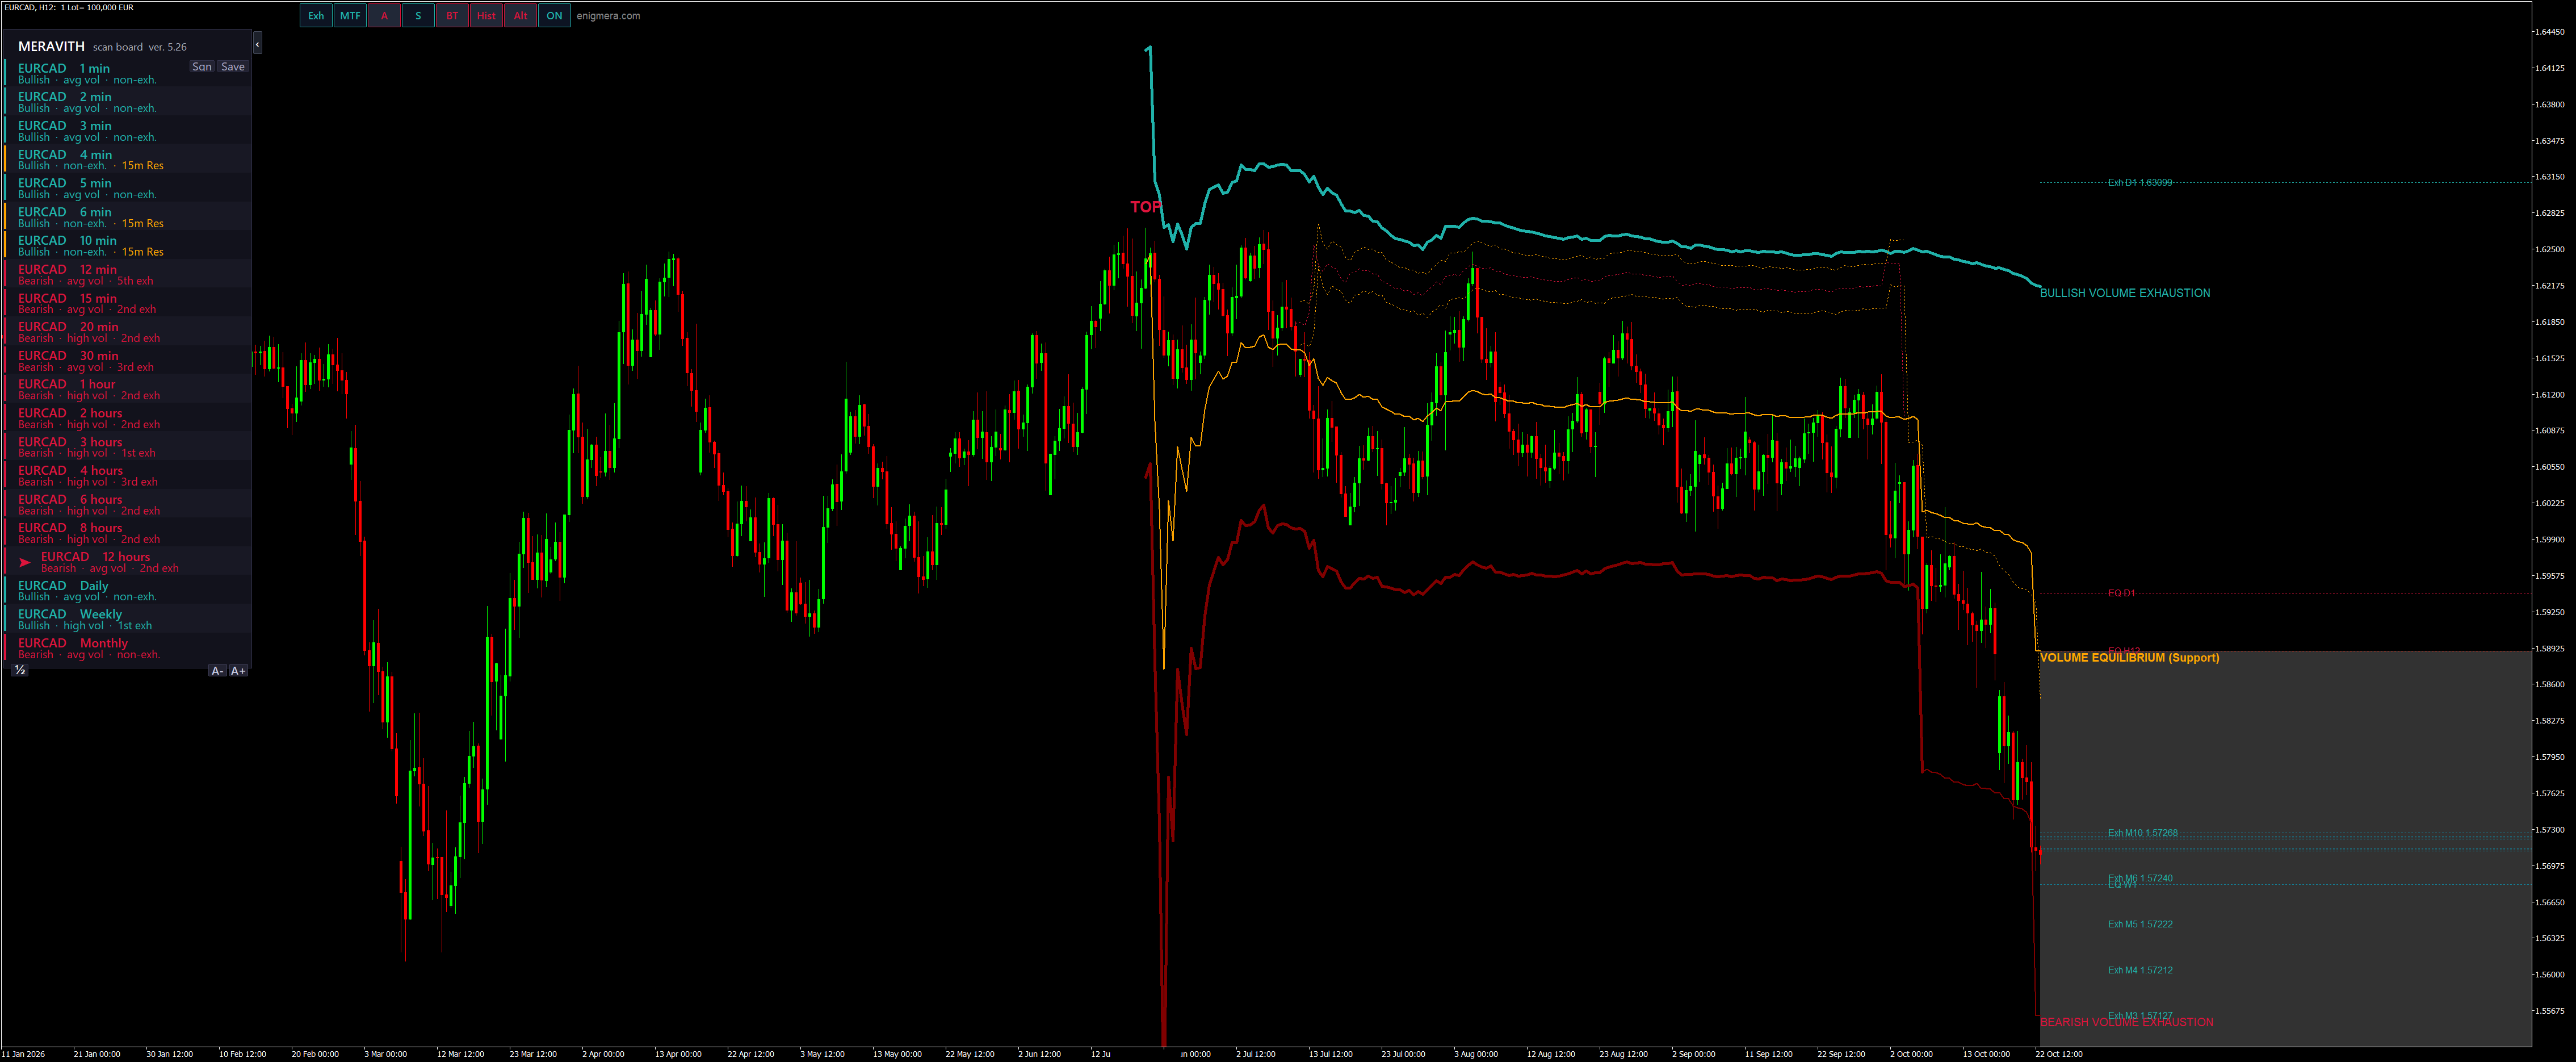
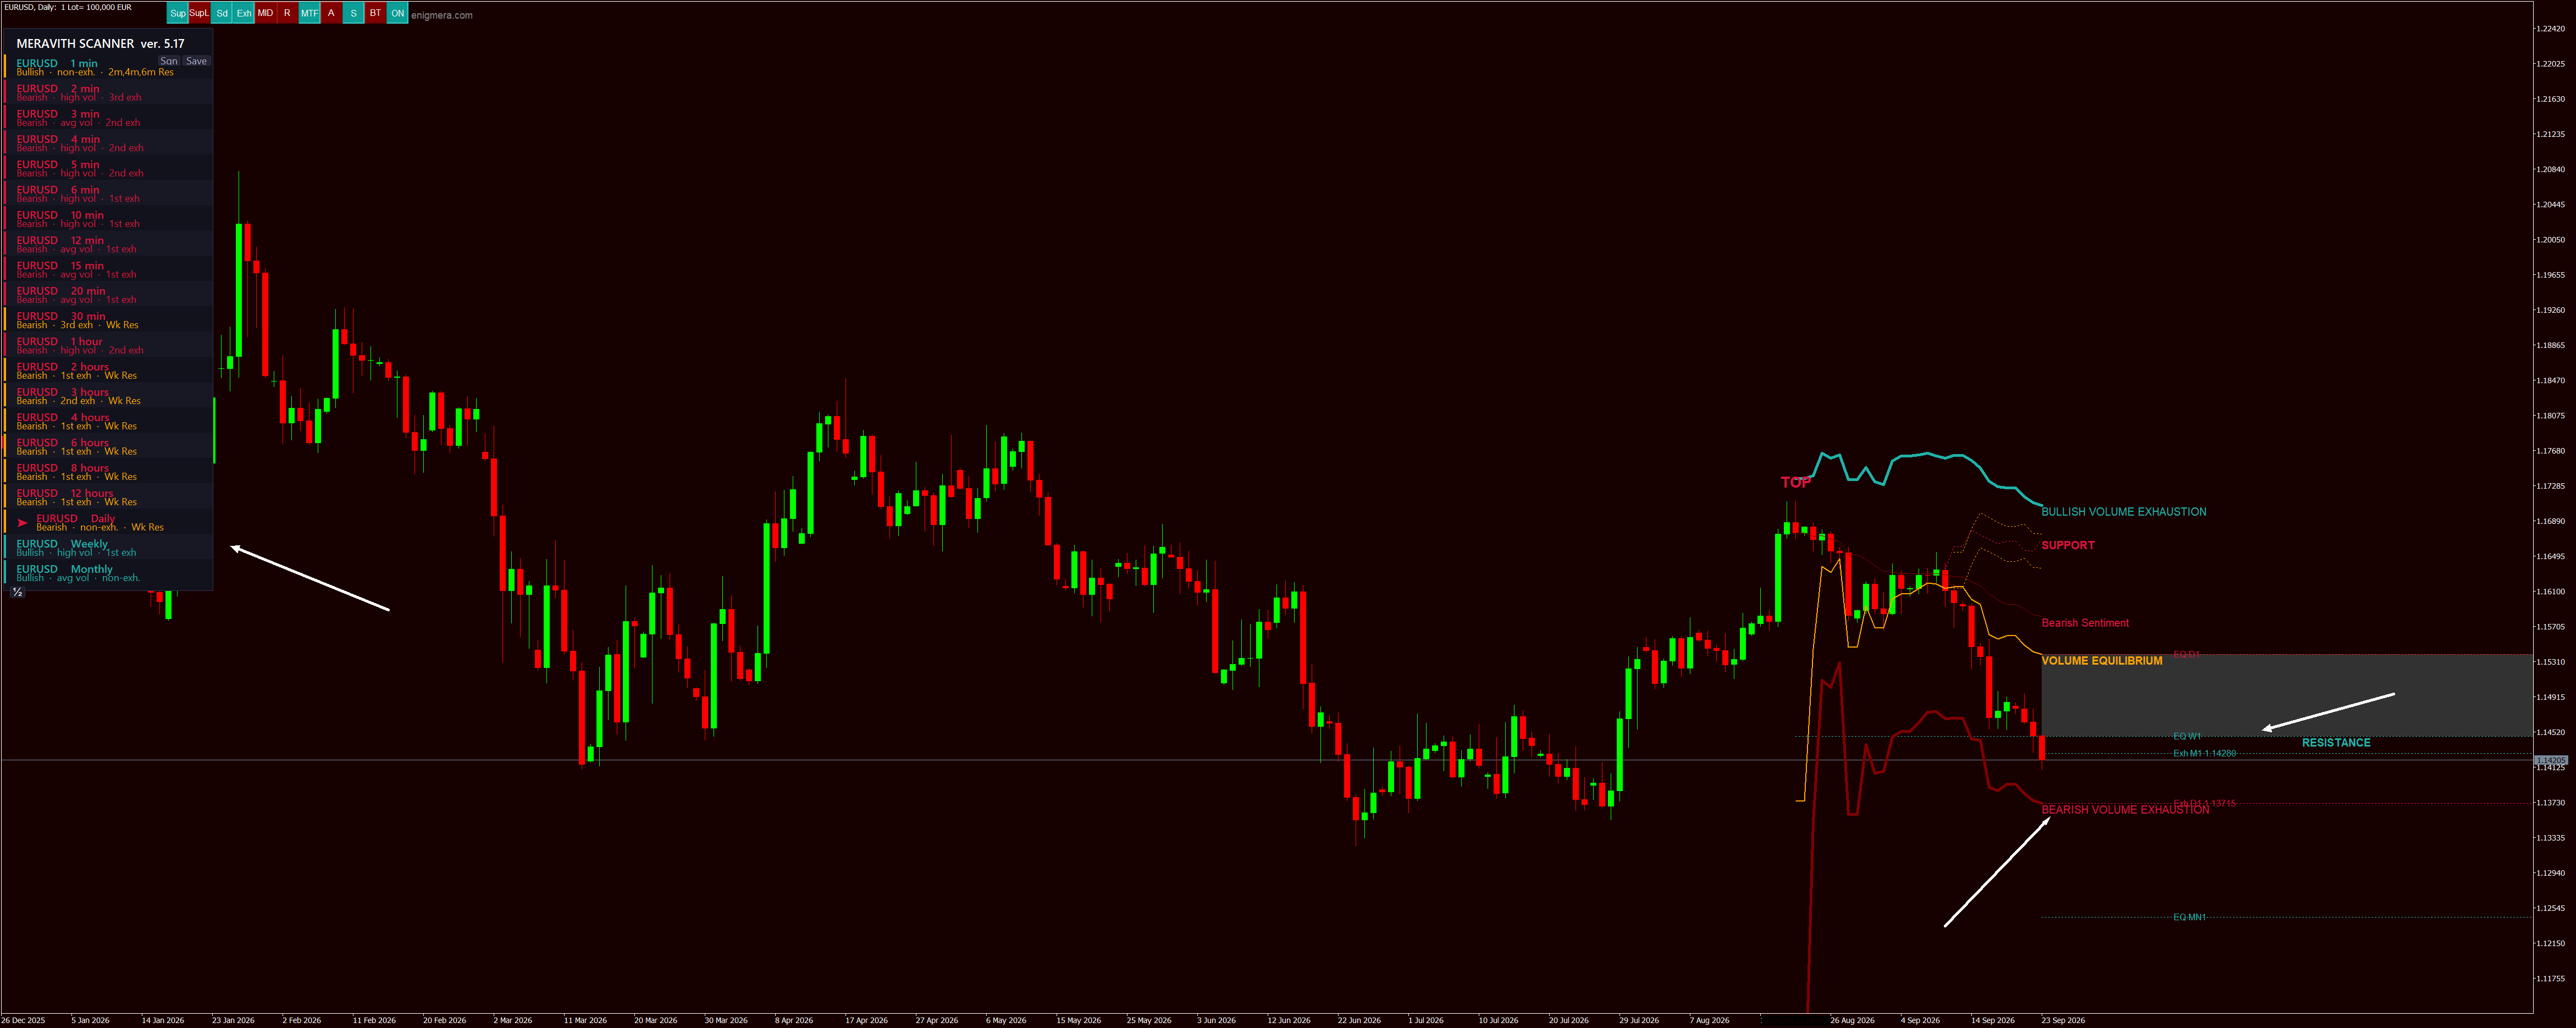
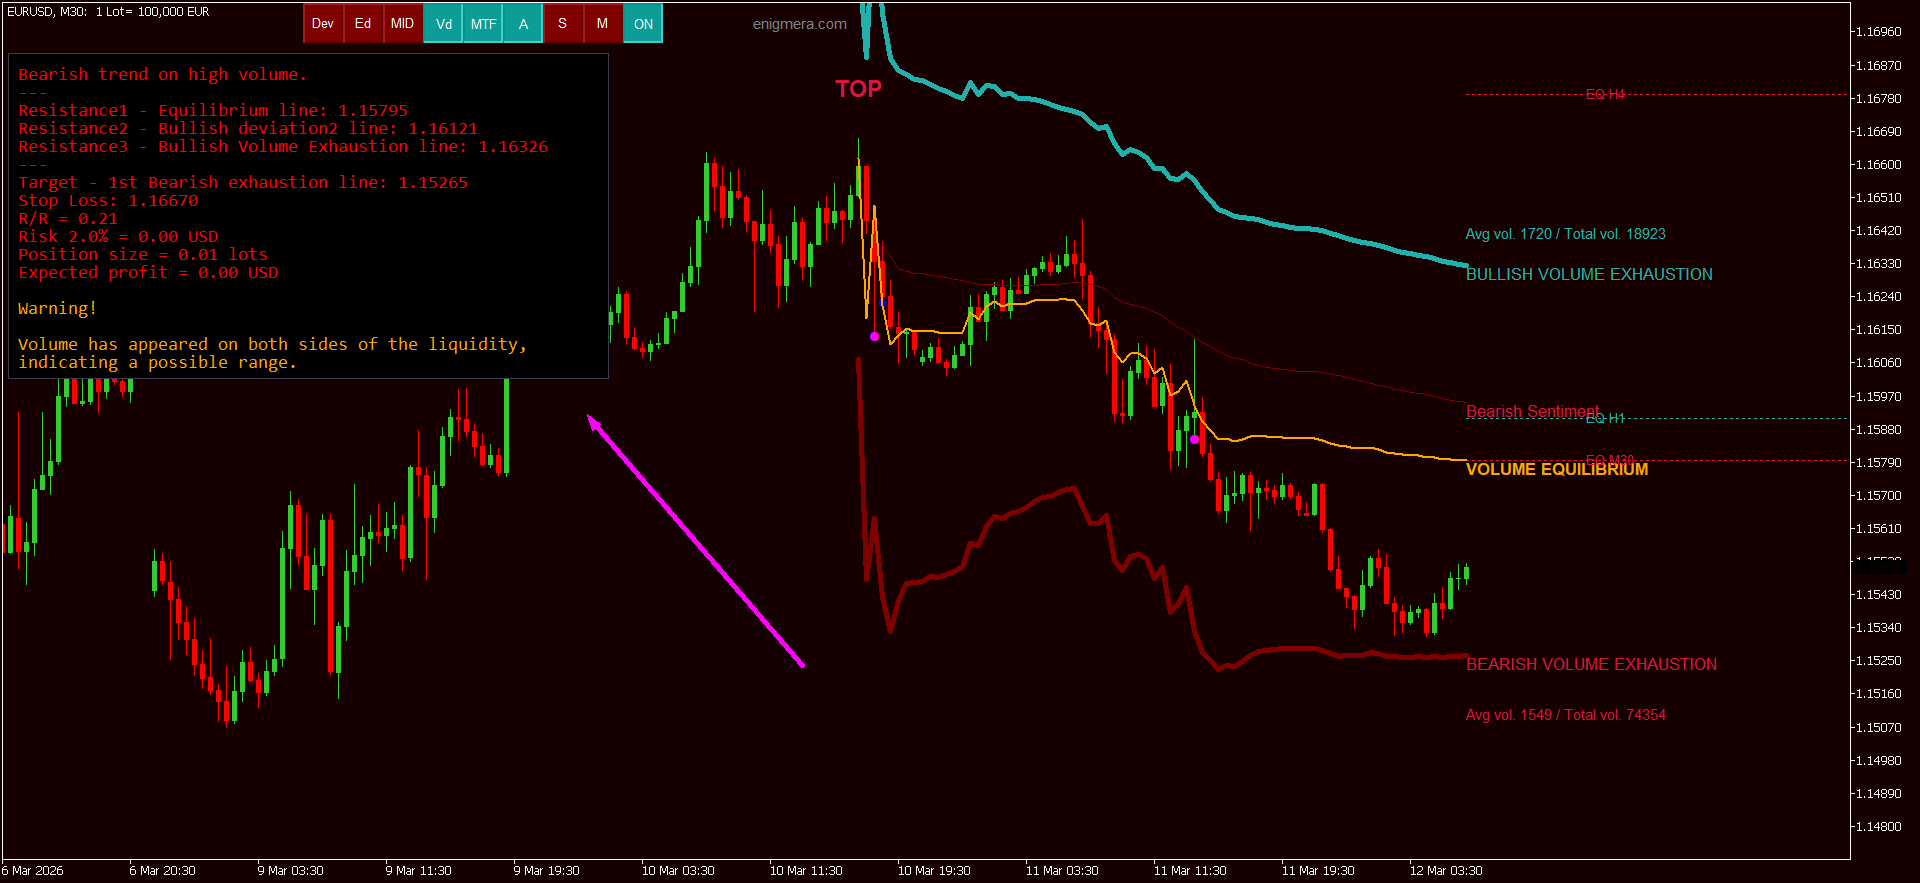
Meravith, for example, is perhaps the strongest market context engines available, at least from what I have seen so far.
It takes into account trend, previous trend, volume, volume exhaustion, volume balance, the interaction between trends across different timeframes, the interaction between volumes, and support calculated through several different algorithms depending on the current market phase.
It also distinguishes between a trend with volume and a trend without volume. It considers resistance levels from higher timeframes and many other structural elements.
This is not just an indicator.
This is a market context machine.
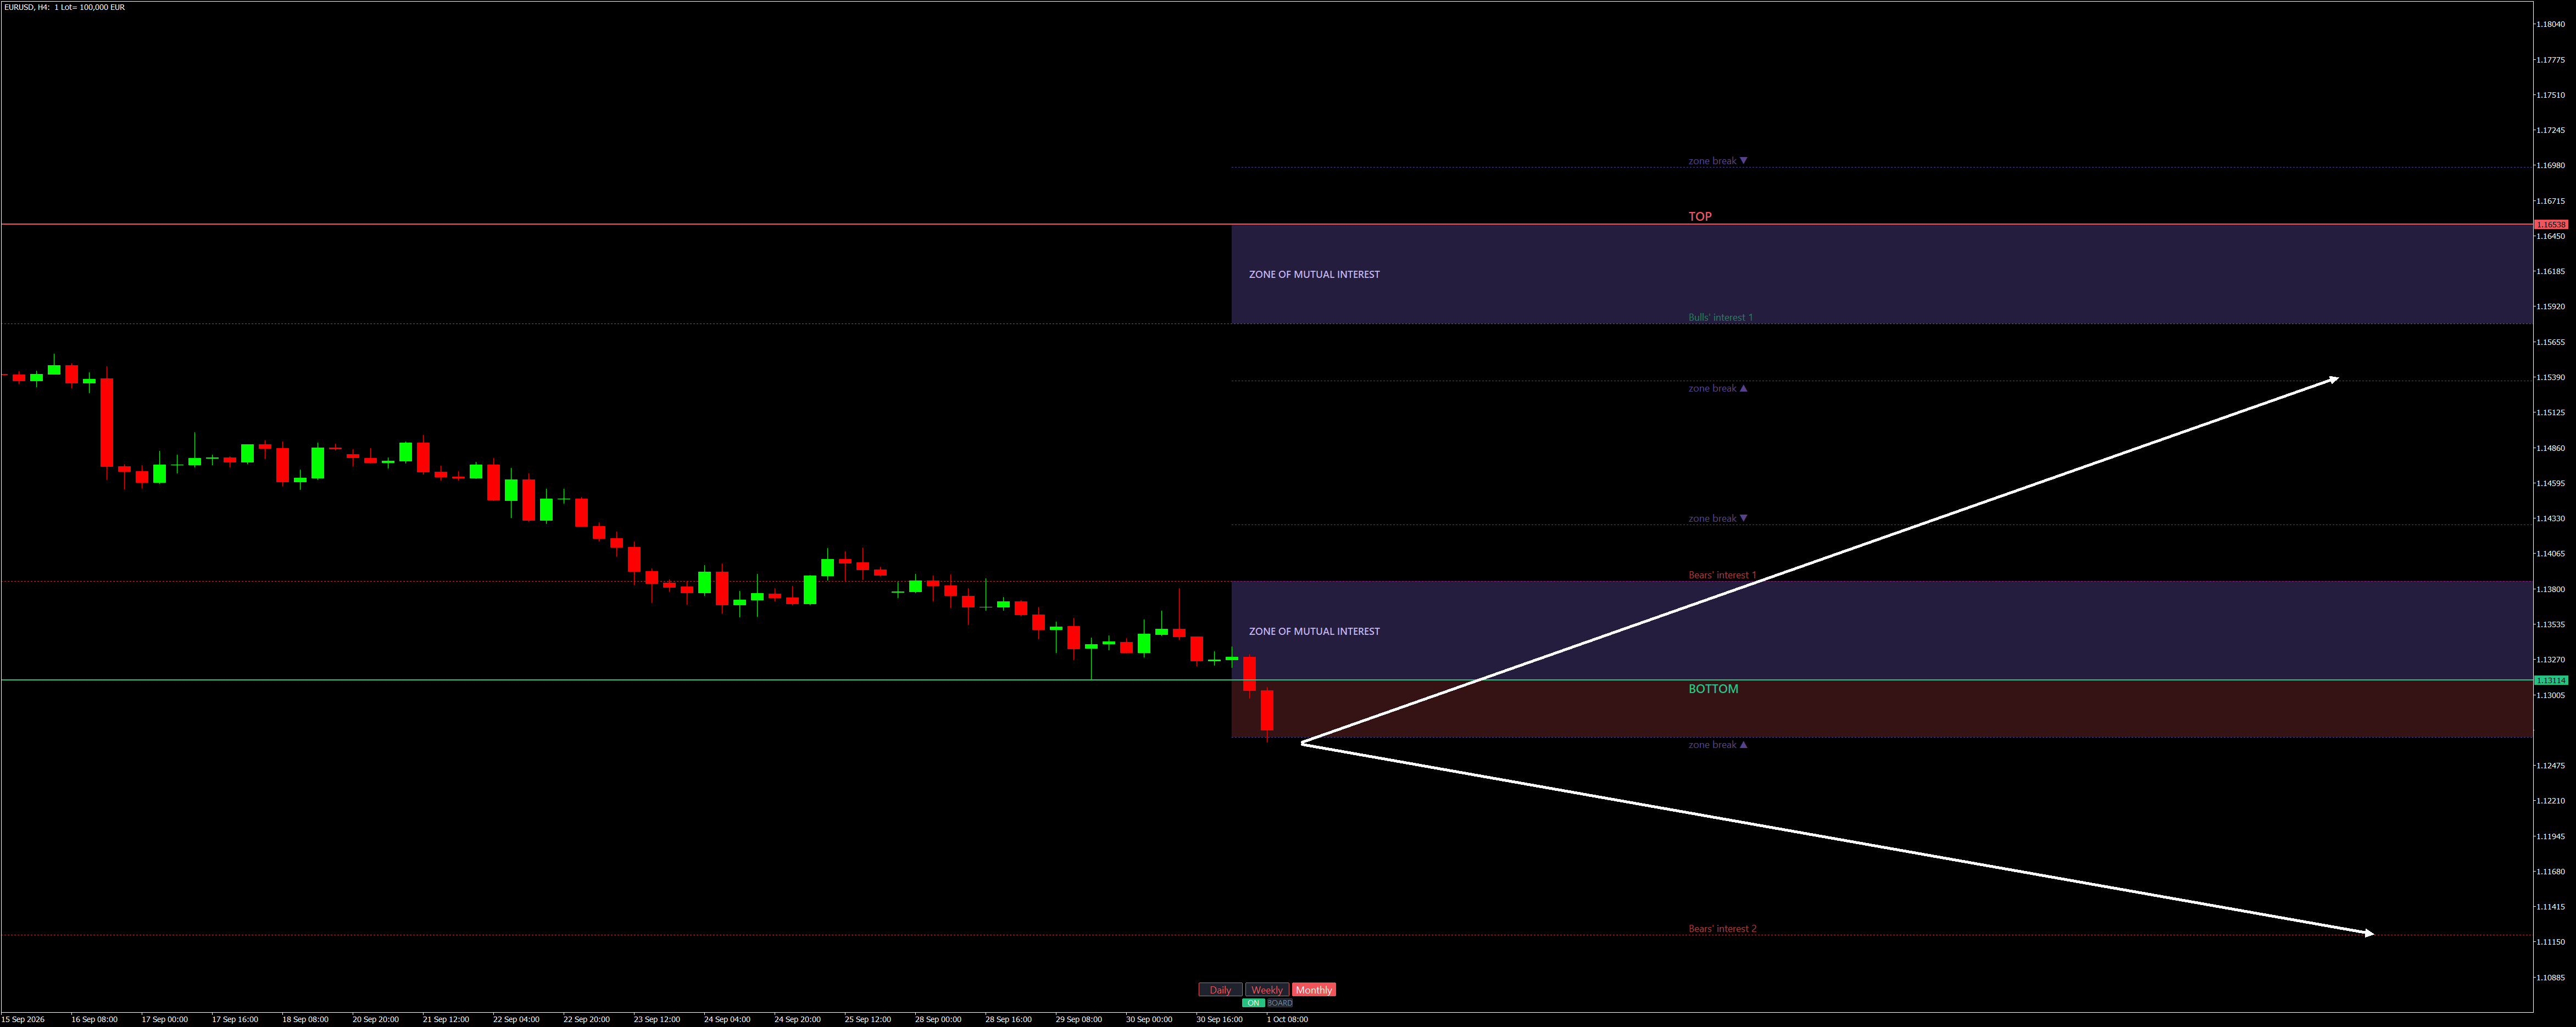
It provides a complete picture: where to enter, where to exit, what to expect, and most importantly, why. These are clearly defined rules followed by the algorithm.
Again, it is still an algorithm. But it is a highly complex one.
It takes into account many small details and uses them to build a broader view of the market. In addition, scanning the entire market across multiple currency pairs provides even more context by showing which currencies are strong, which are weak, and where that strength or weakness appears across different timeframes.
Why Cheap Indicators Cannot Provide Full Context
An indicator that costs $50, $100, or $150 cannot give you full market context.
An indicator without context is cheap at $50, expensive at $100, and very expensive at $150.
But an indicator with some level of context can be cheap even at $150.
What does “some context” mean?
It means the indicator includes certain market conditions in its logic, but those conditions are only a small part of everything that could be analyzed. Still, they can help the indicator produce better signals most of the time.
This category includes indicators that use variable periods based on volatility.
A good example is KAMA: Kaufman Adaptive Moving Average.
A normal moving average has a fixed period. An adaptive moving average constantly recalculates volatility and adjusts itself.
High volatility means a shorter period.
Low volatility means a longer period.
For example, during news events, volatility increases sharply. In that environment, using a standard 50-period moving average may not make sense. An adaptive indicator may reduce the period to something closer to an 8-period moving average. Then, as volatility decreases, it gradually increases the period again, potentially returning to 50, 60, or even 200.
If we think about it carefully, this is a form of context, but it is reactive. It responds to what has already happened in the market.
Still, it is better than using a completely static tool.
Manual Indicators and Trader Responsibility
Another category is manual indicators.
With manual indicators, the responsibility is on you. You must decide where the indicator should start, which point matters, and why that point matters.
In my opinion, this is one of the most honest types of trading tools you can buy.
The programmer is not promising that you will automatically make money. You are buying a tool, not a replacement for analysis.
Then comes the next level: automation of manual indicators.
Again, in this area, Meravith has no real competition. For a long time, it was completely manual, and I could not even imagine that something like this could be automated. The same applies to Transaction Speed.
The Real Role of Indicators
Whatever indicator you use, if you use it without context, you will lose money.
The indicator does not replace you.
It helps you.
But how does it help?
It helps when you already know that the market is bullish and you are waiting for a bullish signal. When the indicator gives you that bullish signal, you buy because the signal is aligned with the market context.
That is the correct way to use an indicator.
Not as a decision-maker.
Not as a prediction machine.
Not as a shortcut.
But as a confirmation tool inside a market context that you have already defined.
Final Conclusion
All of our efforts should be focused not on finding the perfect indicator, but on learning how to define the context of the market.