MT4 · MT5 · TradingView

The market leaves its levels behind.
These indicators find them.

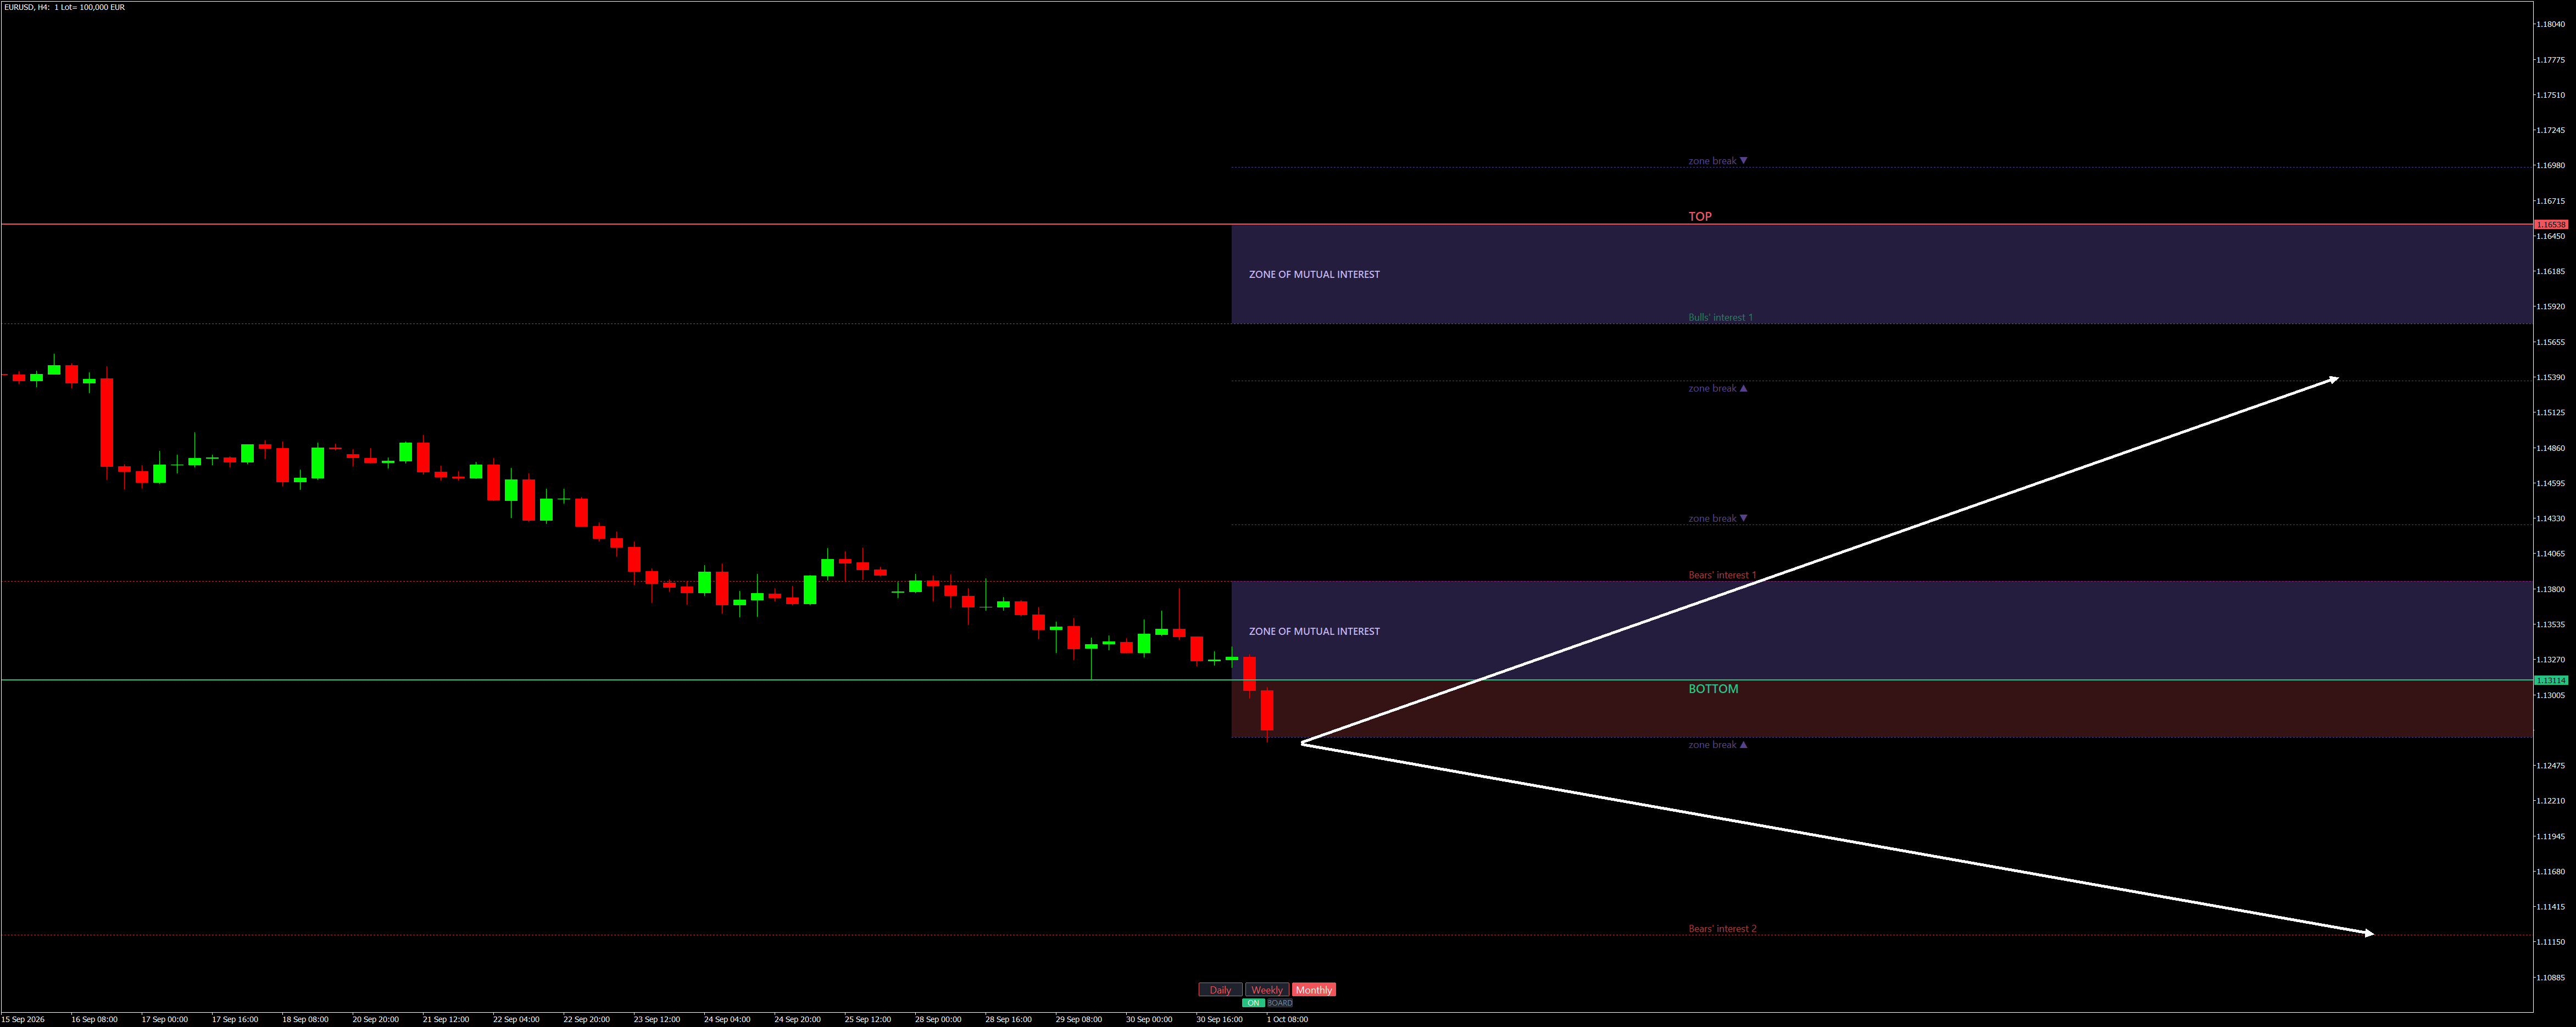
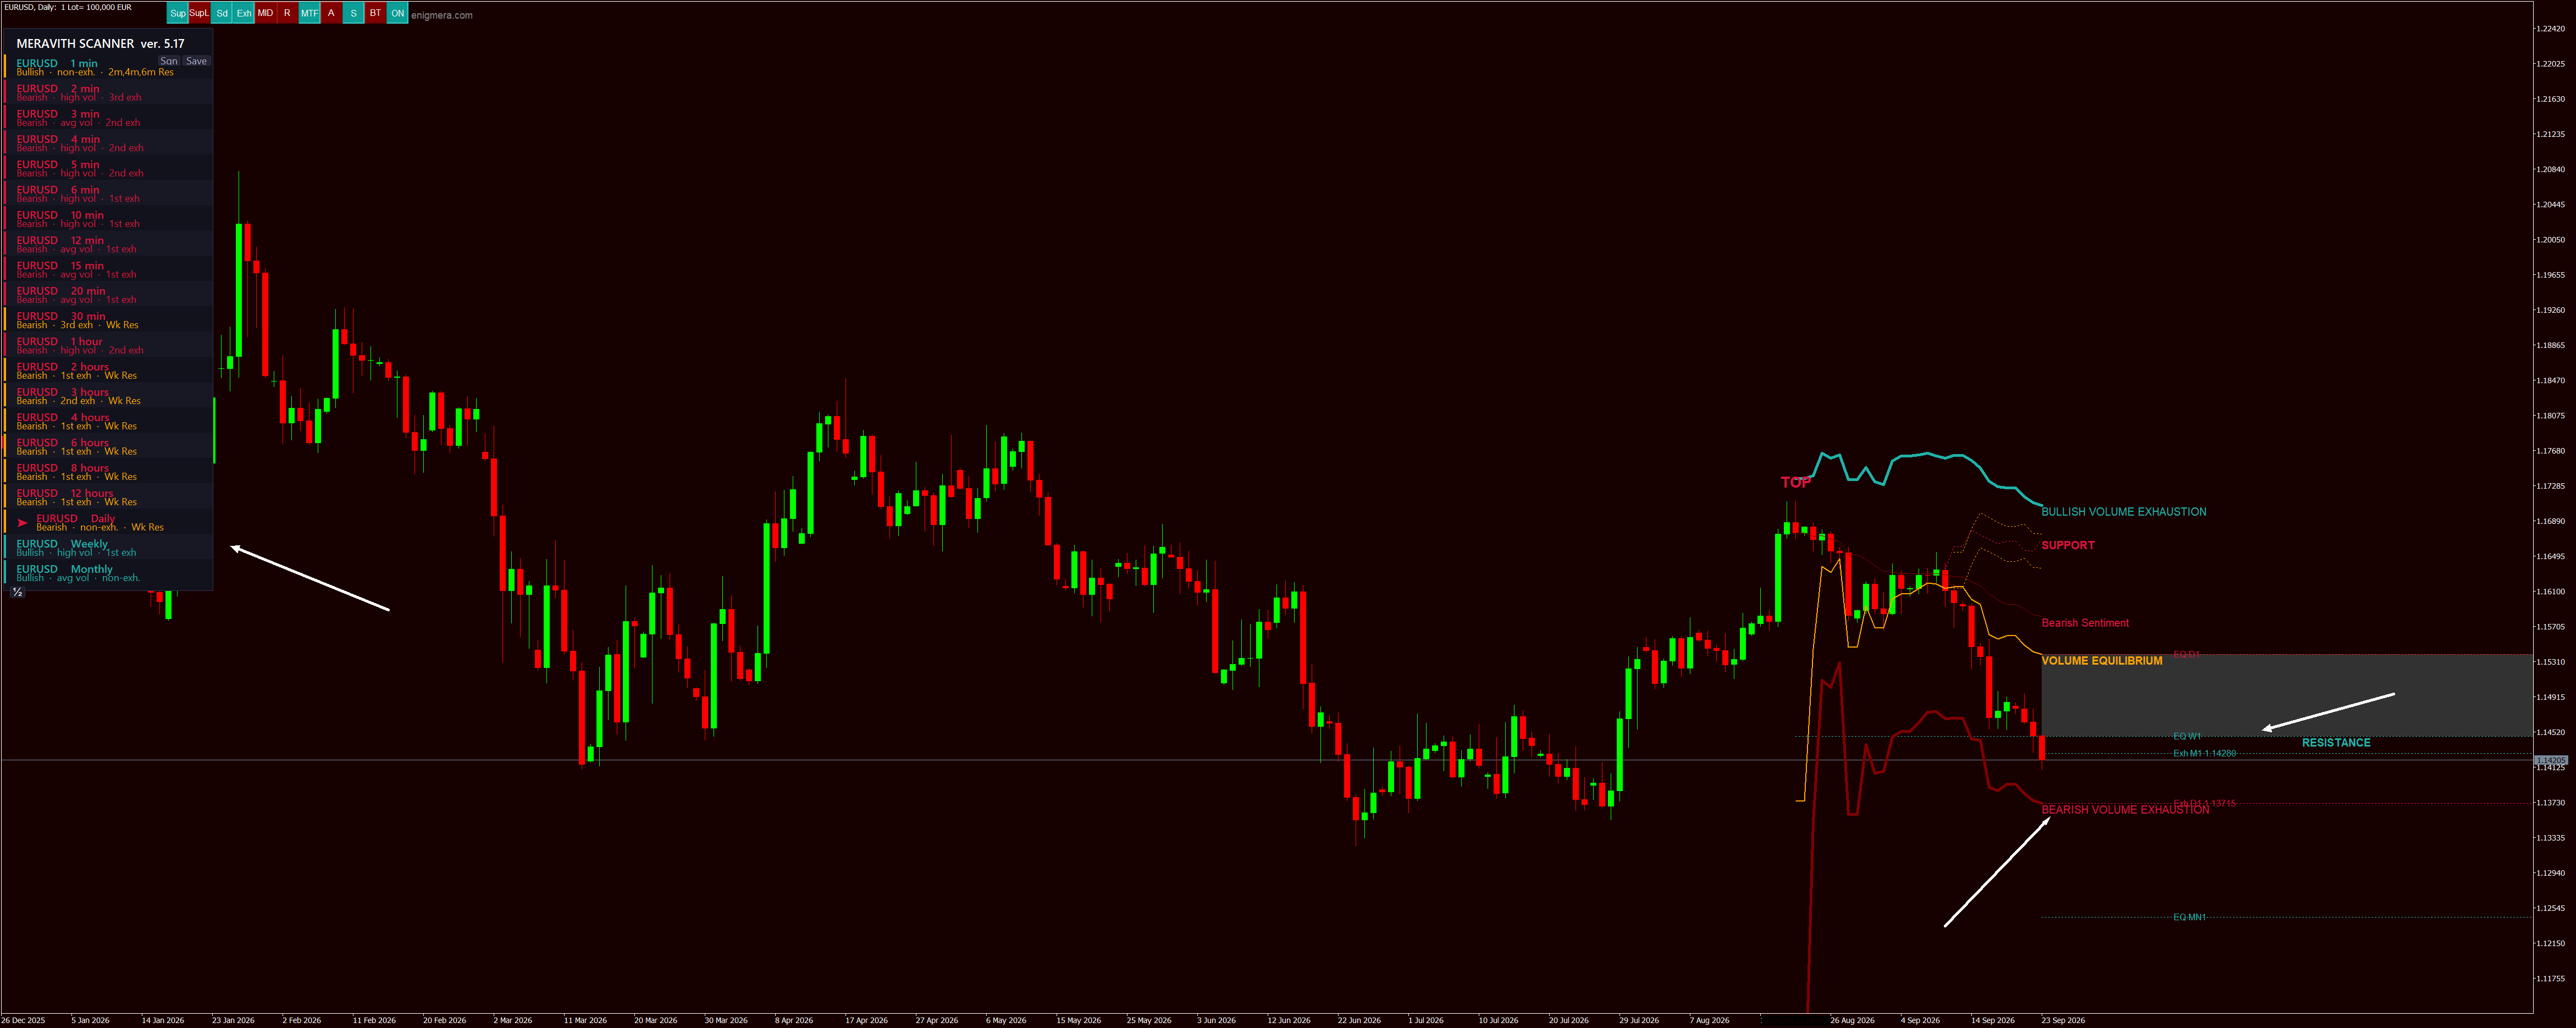
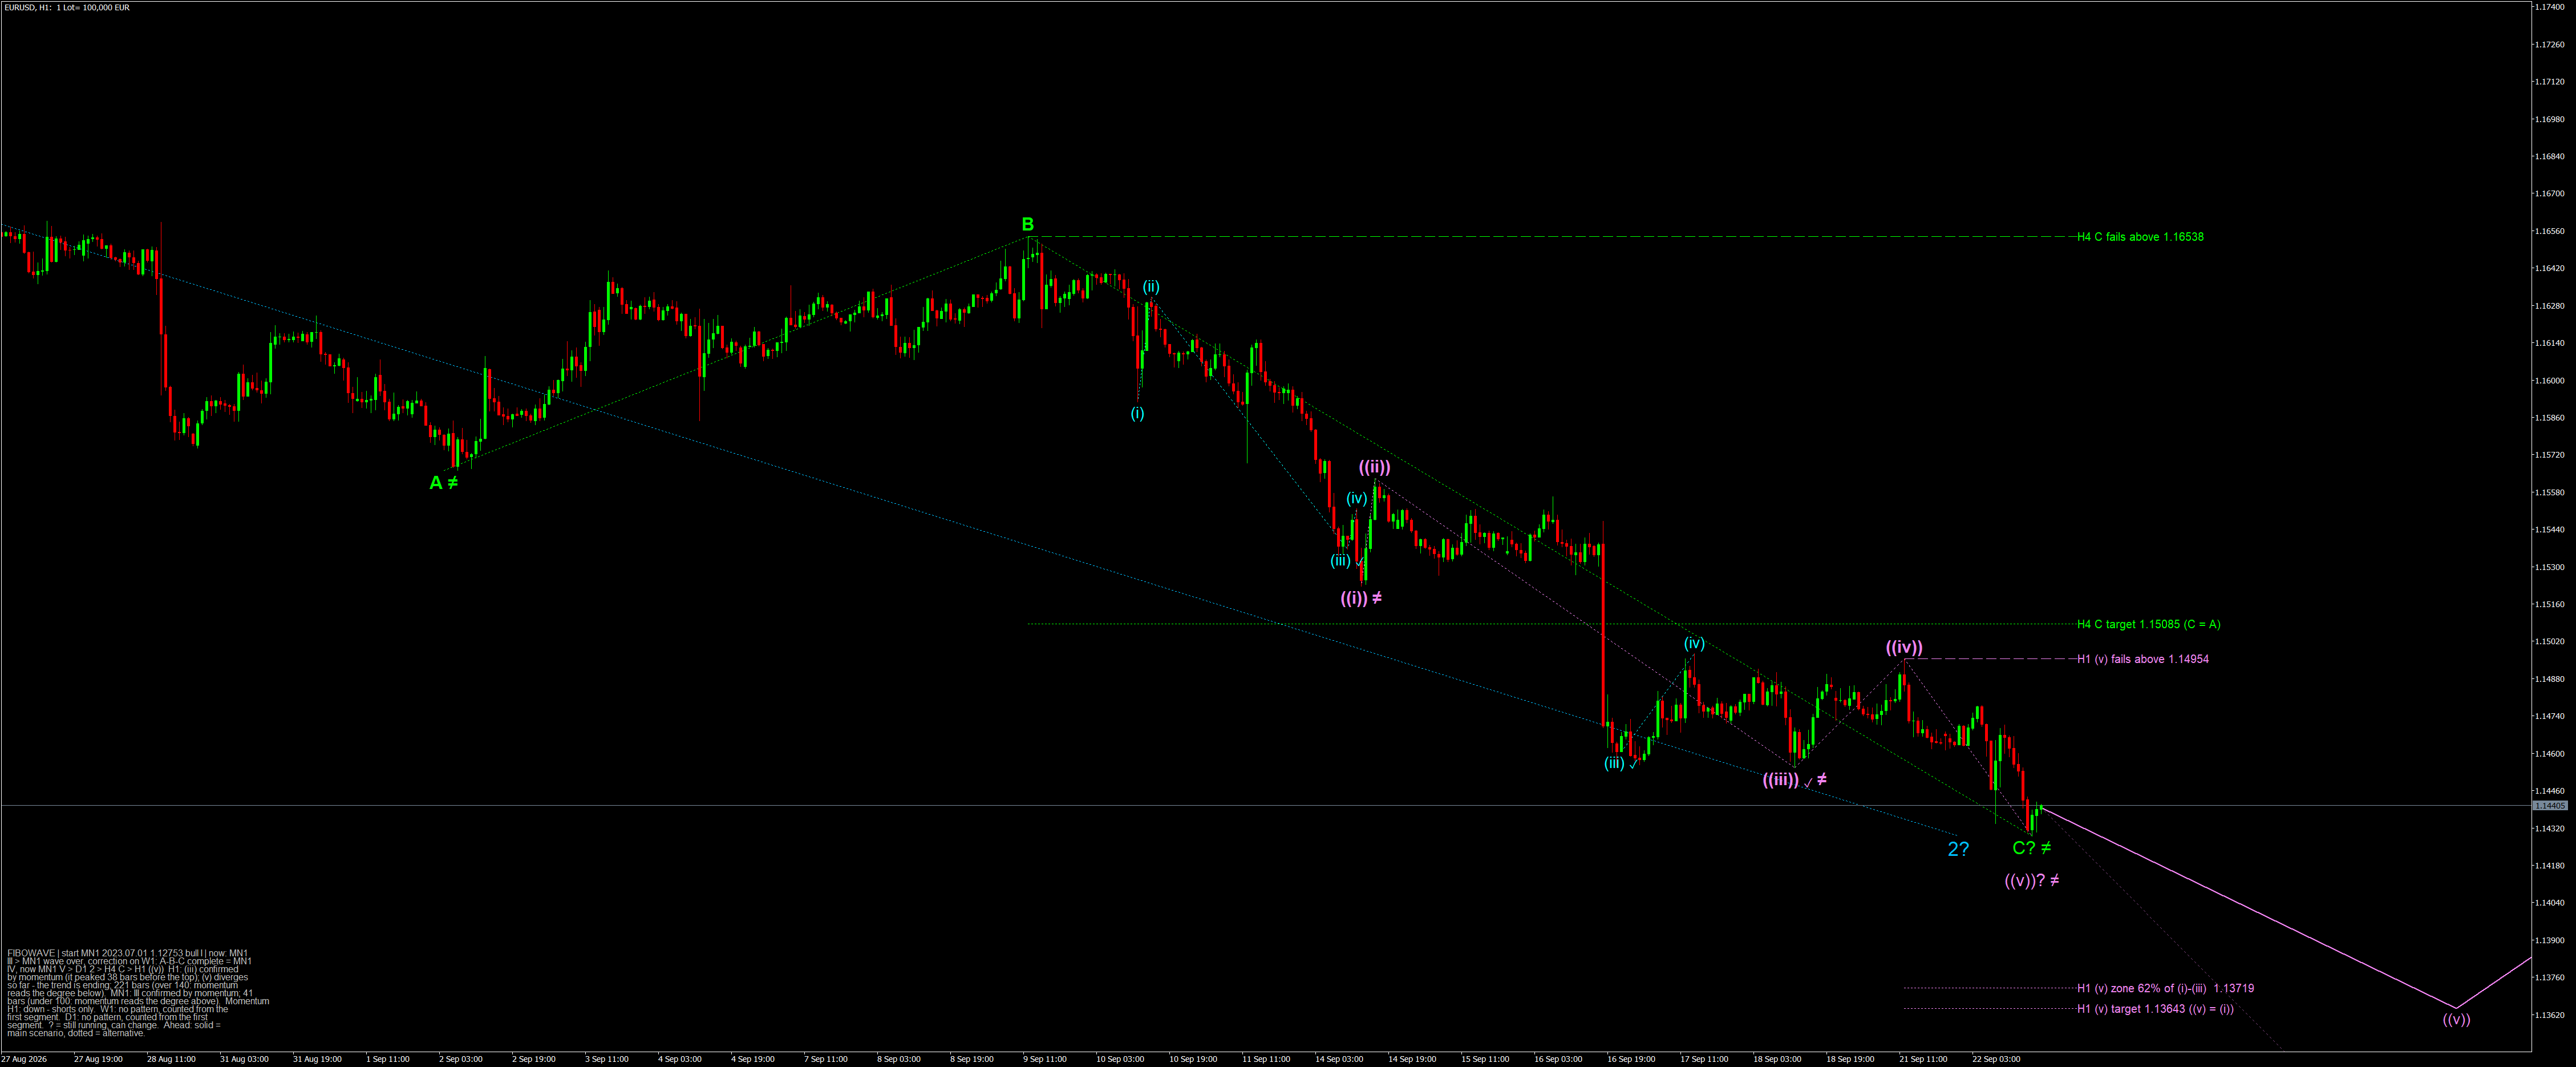
Review the market in full. MERAVITH shows you what is happening right now. It analyzes volume and price across every timeframe — from the lowest to the highest. It shows where financial interest is concentrated, where there is buying and where there is selling. This gives you market context — something ordinary indicators cannot provide.

  • Discover where price finds support
  • See where the indicator detects resistance
  • Check where trading volume runs out

Bought once, yours for good — or rented by the month. Written and supported by one developer, who answers.

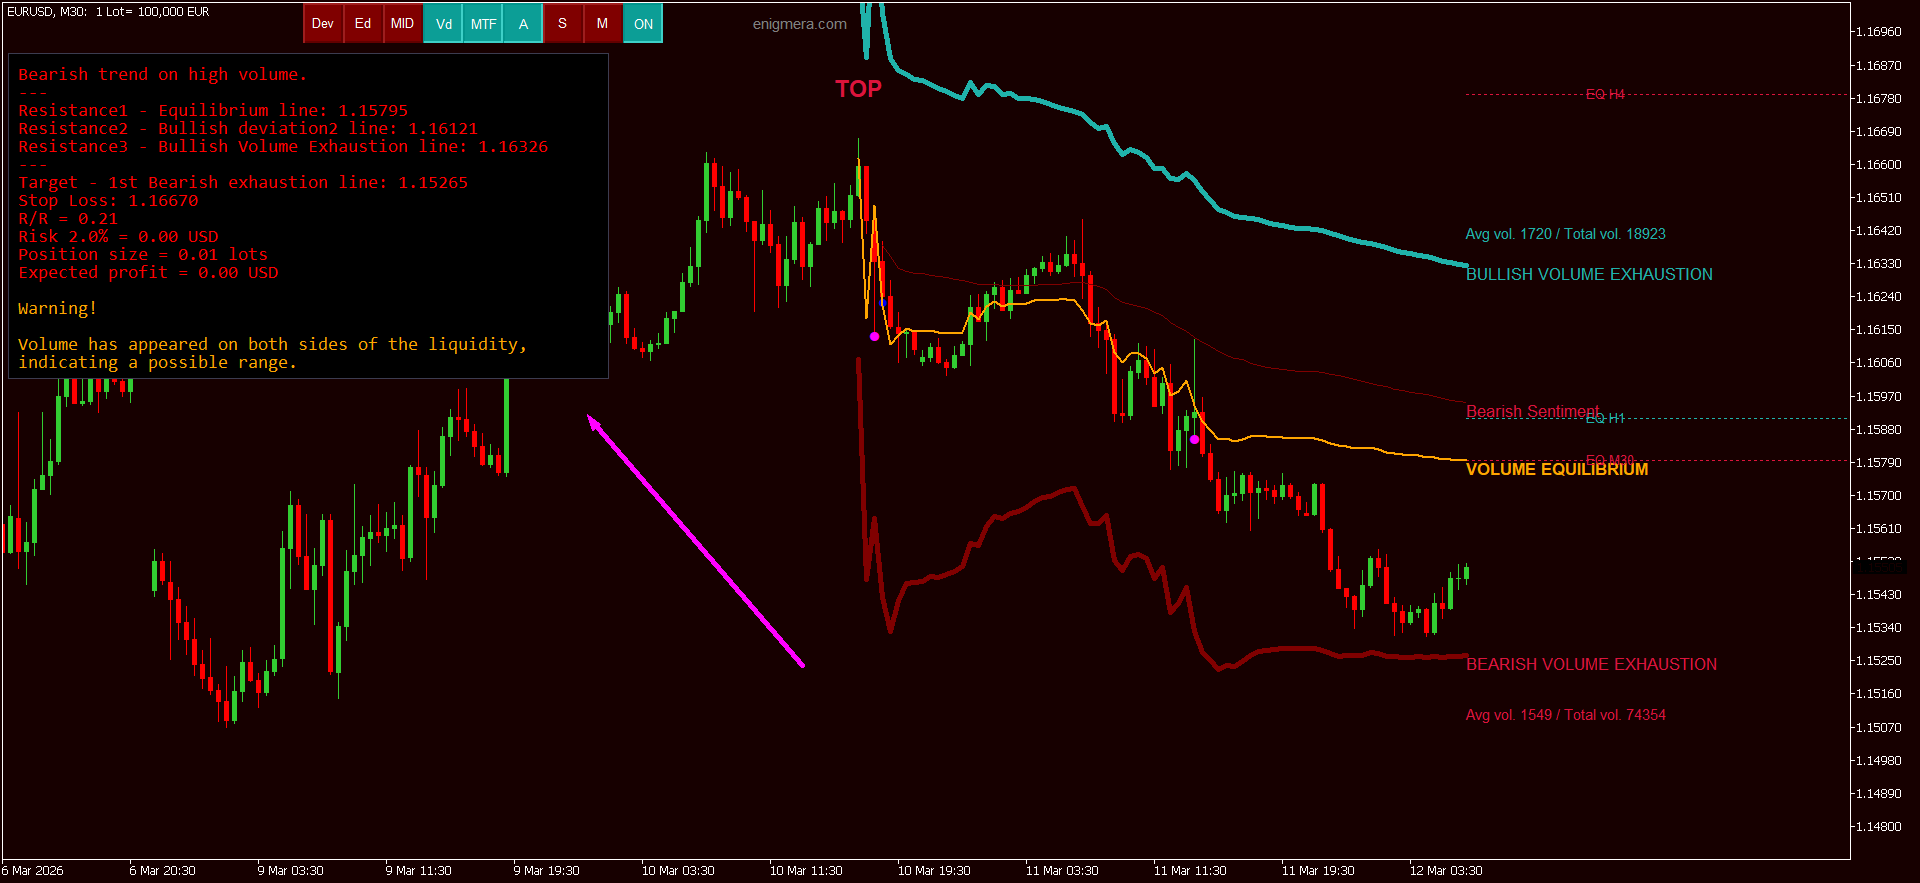
MERAVITH on EURUSD M30: the volume equilibrium line, both volume exhaustion levels, and the panel reading out resistances, target, stop loss and position size
MERAVITH on EURUSD M30 — and its own reading of what is on the chart
★★★★★

“By far, one of the best indicators I've ever bought. It's extremely accurate, and the support and attention from the creator are the best I've seen around here.”

Gabriel De Araujo Lobo · April 2026 · MQL5
★★★★★

“There is nothing else that can match this trading system. Finally something that makes sense and actually works. Ivan is kind and very helpful, he answers questions and gives good guidance.”

adrian100379 · July 2026 · MQL5
★★★★★

“The best system on the market. I recommend it with pleasure. He is happy to help you and works on improvements every day.”

Valeriu-alexandru Petrache · March 2026 · MQL5

Cuique pugnae sua instrumenta sunt

Today's Market Snapshot - 12 November 2026
Fresh market intelligence and trading notes, surfaced first.

Quando os indicadores funcionam e quando não funcionam: a verdade brutal que a maioria dos traders se recusa a aceitar

No trading existe uma mentira enorme que não para de ser repetida: a de que os indicadores vão te mostrar a direção, te dar sinais e te tornar lucrativo. Aqui dá para incluir os expert advisors também. As pessoas jogam essas coisas no gráfico como ícones sagrados, rezam para elas, esperam que “digam alguma coisa” e depois se perguntam por que continuam perdendo. A verdade é simples, mas dolorida: indicadores não funcionam sozinhos. Eles não pensam, não analisam, não entendem o mercado. Não passam de fórmulas matemáticas medindo o passado. E se você não entende o mercado, o indicador não vai te salvar. Ele vai te destruir.
O maior erro dos iniciantes é usar indicadores sem contexto. Eles colocam RSI, MACD, algum “super indicador”, e esperam um milagre. É como encarar um espelho esperando que ele mostre o futuro. Um indicador só mostra os últimos candles. Se os últimos candles são caos — o indicador é caos. Se eles não têm direção — o indicador não tem direção. E quando o trader vê o indicador “apontando para cima” enquanto o preço cai, ele começa a culpar o indicador, culpar o mercado, culpar o mundo. Mas a verdade é que ele culpa todo mundo menos ele mesmo. Porque não entendeu a coisa mais básica: um indicador não é um cérebro. É uma calculadora.
Pior ainda é quando alguém afirma que um indicador só funciona em um par ou em um tempo gráfico. Isso é fraude pura. Se a lógica é boa, funciona em qualquer lugar. Se só funciona no ouro ou só no M5, isso não é lógica — é um brinquedo ajustado para parecer bom em um lugar e estourar sua conta em todos os outros. O mercado não liga para os seus indicadores. Ele se move por estrutura, impulso, liquidez. Se o indicador não consegue ler isso, ele é inútil.
E, ainda assim, existem momentos em que os indicadores funcionam muito bem. Mas isso só acontece quando o trader tem contexto — contexto real, lógico, consistente. Quando você sabe o que está acontecendo no mercado, quando entende a estrutura, quando enxerga a direção, então o indicador vira uma ferramenta. Não um mestre, e sim um assistente. Se sua análise mostra que o mercado está de alta, o indicador pode te ajudar a achar o momento certo de entrar. Mas se o indicador te der um sinal de baixa, você não vai segui-lo, porque seu contexto diz outra coisa. Essa é a diferença entre um trader que pensa e um trader que fica encarando setinhas.
Indicadores só funcionam quando *você* trabalha direito. Quando você pensa, quando analisa, quando entende o mercado. Se você fica esperando o indicador te dizer o que fazer, já perdeu. Indicadores não ganham dinheiro. Análise ganha dinheiro. Contexto ganha dinheiro. Lógica ganha dinheiro. O indicador é só uma ferramenta — e se você usá-lo como estratégia, ele vai te destruir.
E é exatamente aqui que aparece a diferença real entre indicadores que só desenham linhas e aqueles que entregam contexto de verdade. O Meravith é o único indicador que constrói automaticamente contexto real em tempo real por meio da sua análise multi-timeframe. Ele não espera você decidir para onde olhar — ele analisa o mercado por conta própria, reúne a estrutura de todos os tempos gráficos e te apresenta isso como um quadro claro. Isso não é só um indicador. Isso é um cérebro trabalhando para você. O Transaction Speed também entrega contexto pela forma como mede impulso e velocidade do movimento, mas o Meravith segue sendo o único que faz isso de forma totalmente automática e sem o seu envolvimento.
Do outro lado estão os indicadores manuais como o Naturu e o Speculator. Eles também entregam contexto, mas esse contexto depende inteiramente de quem os configura. A ferramenta não analisa sozinha — o trader analisa através da ferramenta. E se o trader sabe o que está fazendo, essas ferramentas manuais podem ser incrivelmente poderosas. Mas se ele não sabe — são só mais uma linha colorida no gráfico.
A verdade é dura, mas simples: contexto automático — real, consistente, multi-timeframe — vem só do Meravith. Todo o resto é trabalho manual ou ilusão. E um trader que não entende contexto não tem chance. O mercado não perdoa quem fica encarando setinhas. O mercado premia apenas quem pensa.
https://www.enigmera.com/indicators.html?indicator=meravith-scanner
Share post:
Facebook X LinkedIn Telegram WhatsApp
Markets today MERAVITH · D1
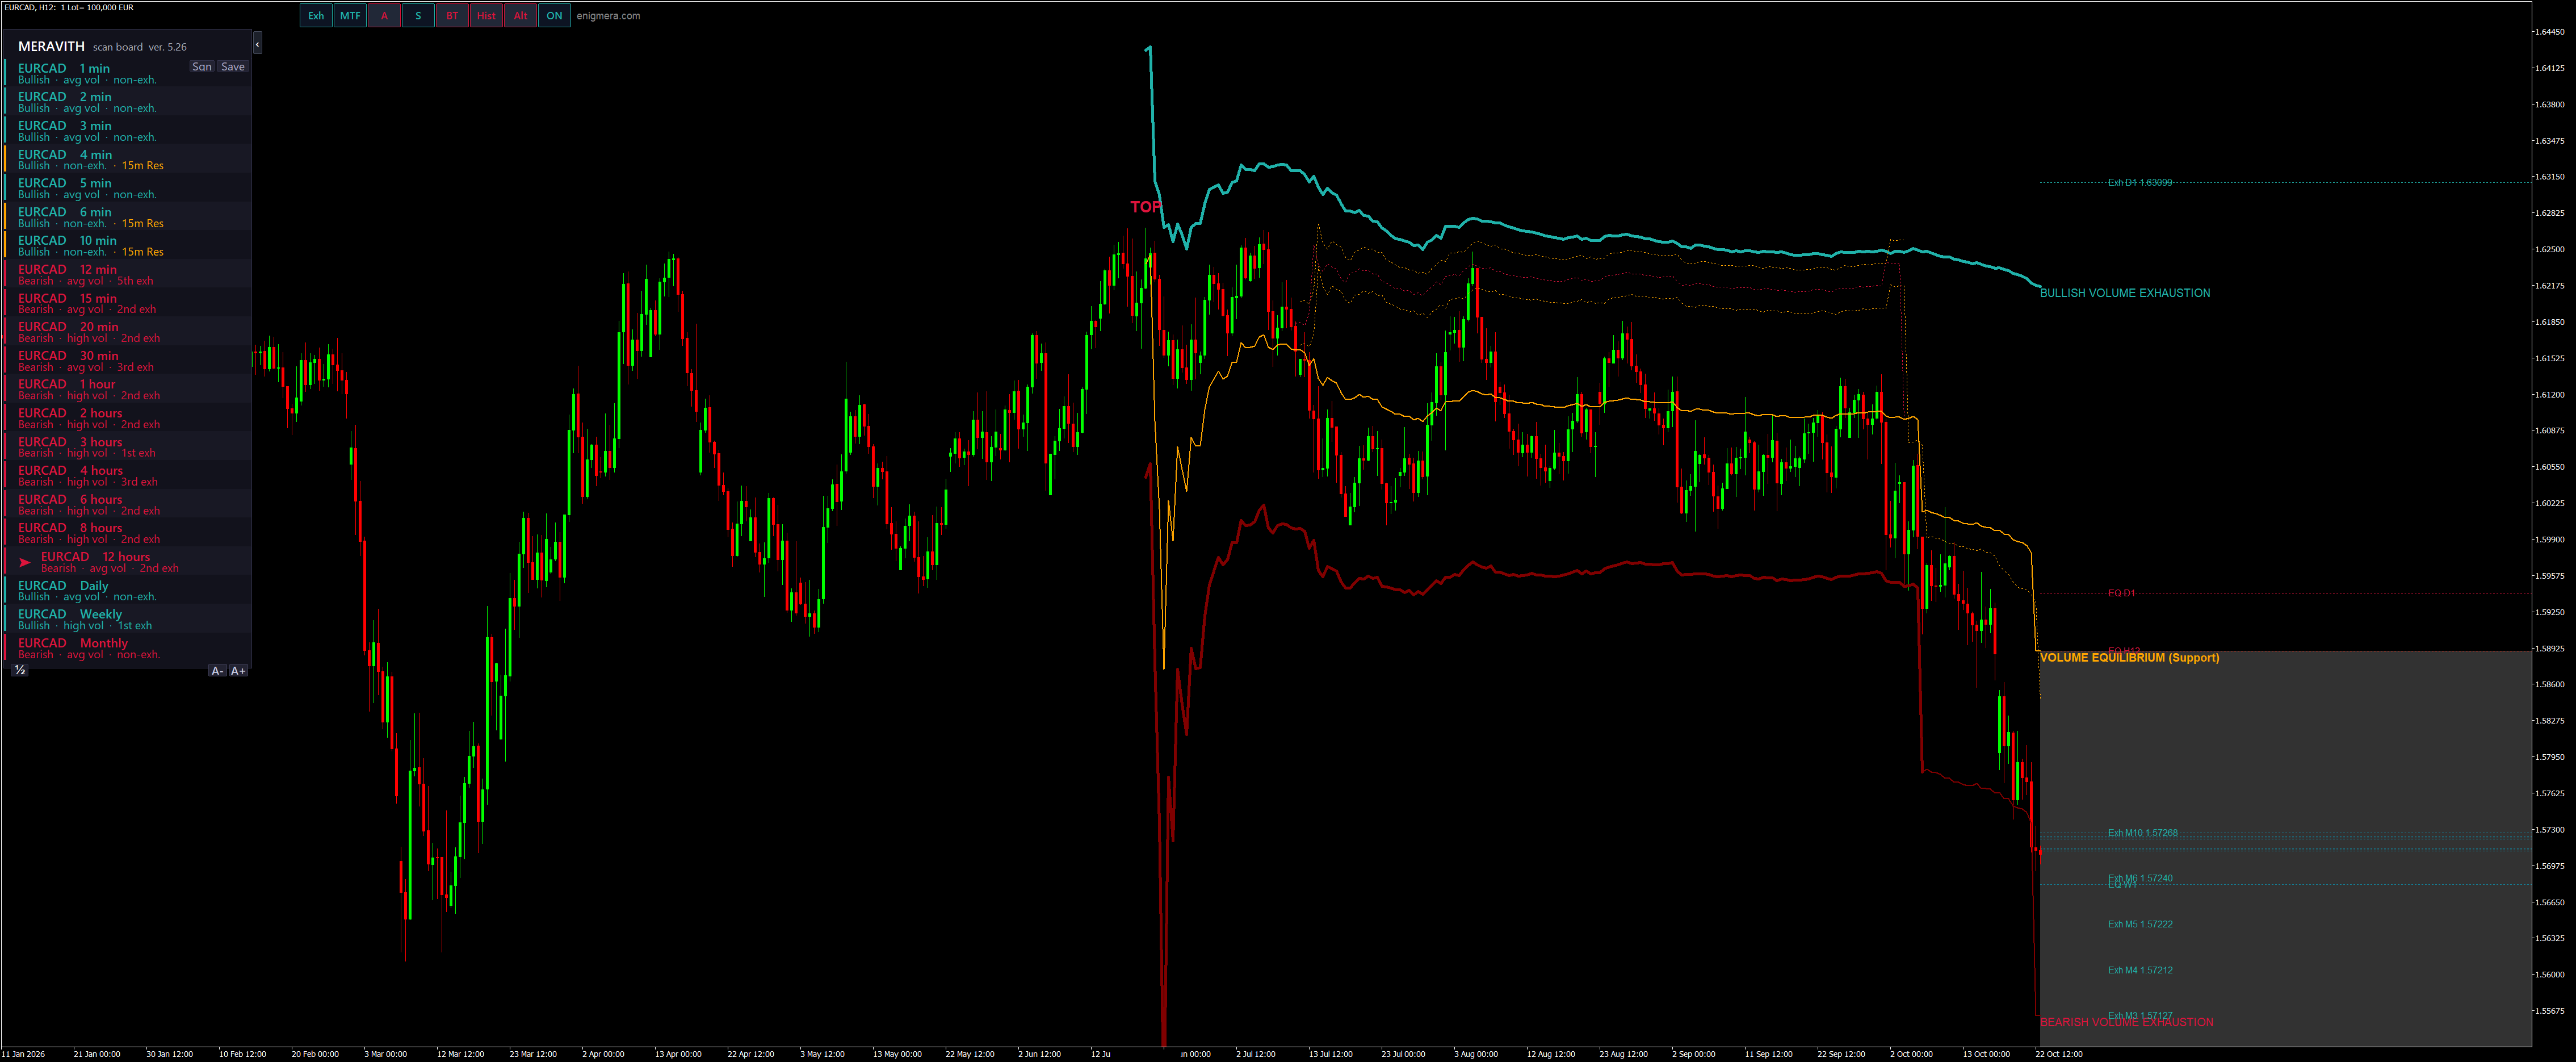
Today's trading example EURCAD
One EURCAD trade, from the scan to the exit
The scan, the exhausted cluster, the entry with Alt and the exit at the higher resistances.
Watch on YouTube

MERAVITH on the daily chart, last closed day: 05.11.2026 · Not investment advice.

Journal

Trading Far from Fair Value vs. Trend Trading

There are two main ways to trade the market. The first follows the trend and relies on the move continuing. The second trades the return of price to its fair value and relies on the move having gone too far. This article explains why tradin…
Read full post

Need a target? Think about this!

The Target Question: A Matter of Logic Logic first The most important thing in trading is logic. When we apply logic, we achieve results. This article asks one logical question to every reader. There is no ready answer here. Each reader is …
Read full post

Context Is King

How Trading Indicators Really Work Trading indicators do not predict the market. They interpret market data through the algorithms built into them. An indicator does not truly know whether the market is bullish or bearish. It simply display…
Read full post
Page 1 of 3
Analysis
EUR/CAD: a buy after an exhausted bearish Swarm

EUR/CAD: a buy after an exhausted bearish Swarm NEW

1. What the scan shows After a MERAVITH scan, EURCAD shows a run of timeframes from M12 to H12 that are all bearish, and every one of these bearish trends is already exhausted. We call such a group a Swarm: neighbouring timeframes that move in the same direction and have all reac…
Read analysis
What I traded today

What I traded today

One EURCAD trade, from the scan to the exit This is a real trade, read step by step with MERAVITH. 1. The scan. We started by scanning EURCAD on every timeframe, from one minute to one month. One thing stood out at once: from M30 up to H12, eight timeframes in a row were bearish.…
Read analysis
Page 1 of 7
Post Chat Public conversation between users
Loading chat...
Be respectful and stay on topic.