The idea
When every timeframe of a pair points the same way, they are all in one trend, and every one of them has reached an exhaustion, the move has nowhere left to go. The large traders who carried the trend have no more room to profit in that direction. To open new positions at different levels, they need the price to turn.
Think of a shoal of fish. While the small fish and the big fish all swim one way, the shoal moves. When all of them have swum as far as they can, the only way left is back.
Why it cannot be traded every day
A full alignment, every timeframe from 1 minute to Monthly in one trend and exhausted, is rare. On a given pair it happens once or twice a year. A signal that comes that seldom is not a way to trade.
What SWARM does
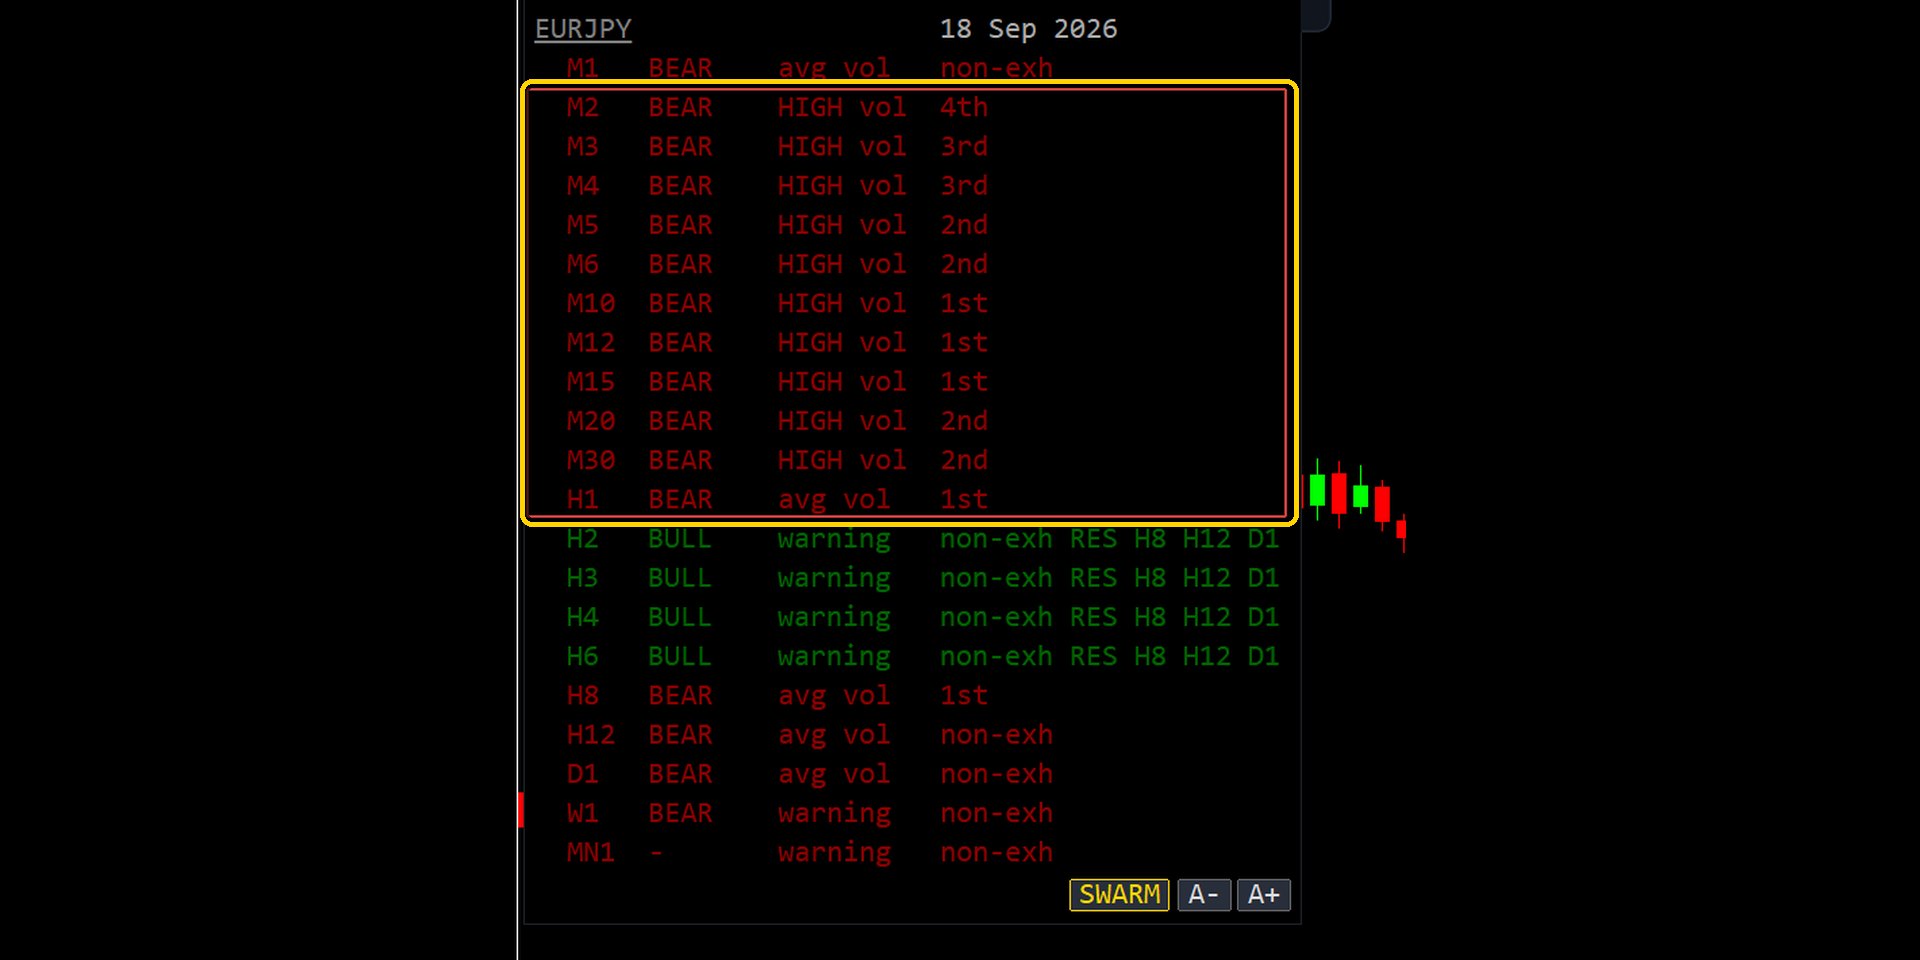
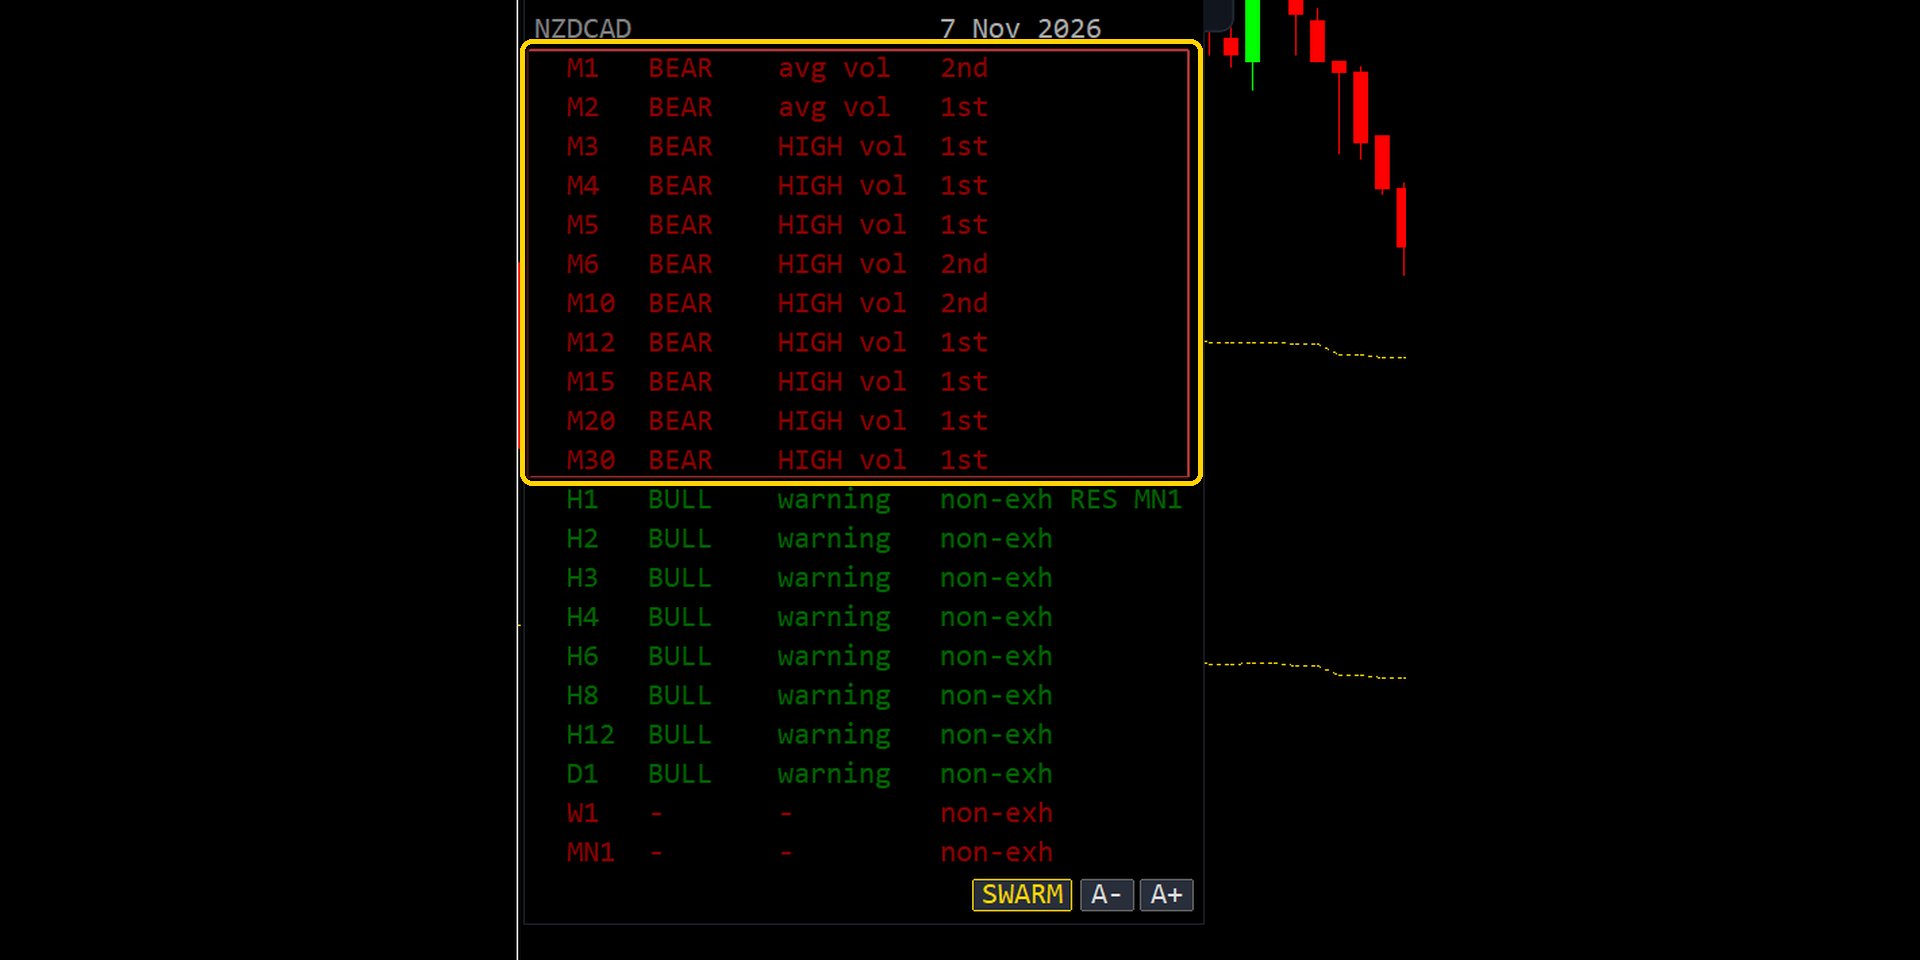
SWARM splits the timeframes into groups. Each group, a swarm, is a run of five or more neighbouring timeframes that are in the same trend and are all exhausted. A pair often has more than one swarm at the same time, for example 1 minute to 1 hour and 4 hours to Daily. Each swarm is a small version of the rare full alignment, and swarms appear often enough to trade.
For each swarm MERAVITH works out its fair value, the levels where to get ready and where to enter, and a target. There is no stop line.
Fair value is a calculated level
The principle is not new. A market has a fair value. When the price moves too far from it, sooner or later it comes back, even if it first keeps moving the other way.
Here fair value is not a vague idea or a zone drawn by eye. It is a level MERAVITH calculates with a fixed algorithm: the equilibrium of a timeframe, computed from price and volume since the trend began on that timeframe. Every timeframe has its own equilibrium, and it is the same number on every chart and for every trader.
The swarm's fair value is the equilibrium of its highest timeframe, the biggest fish in the group. This is where the price is pulled back to.
The levels
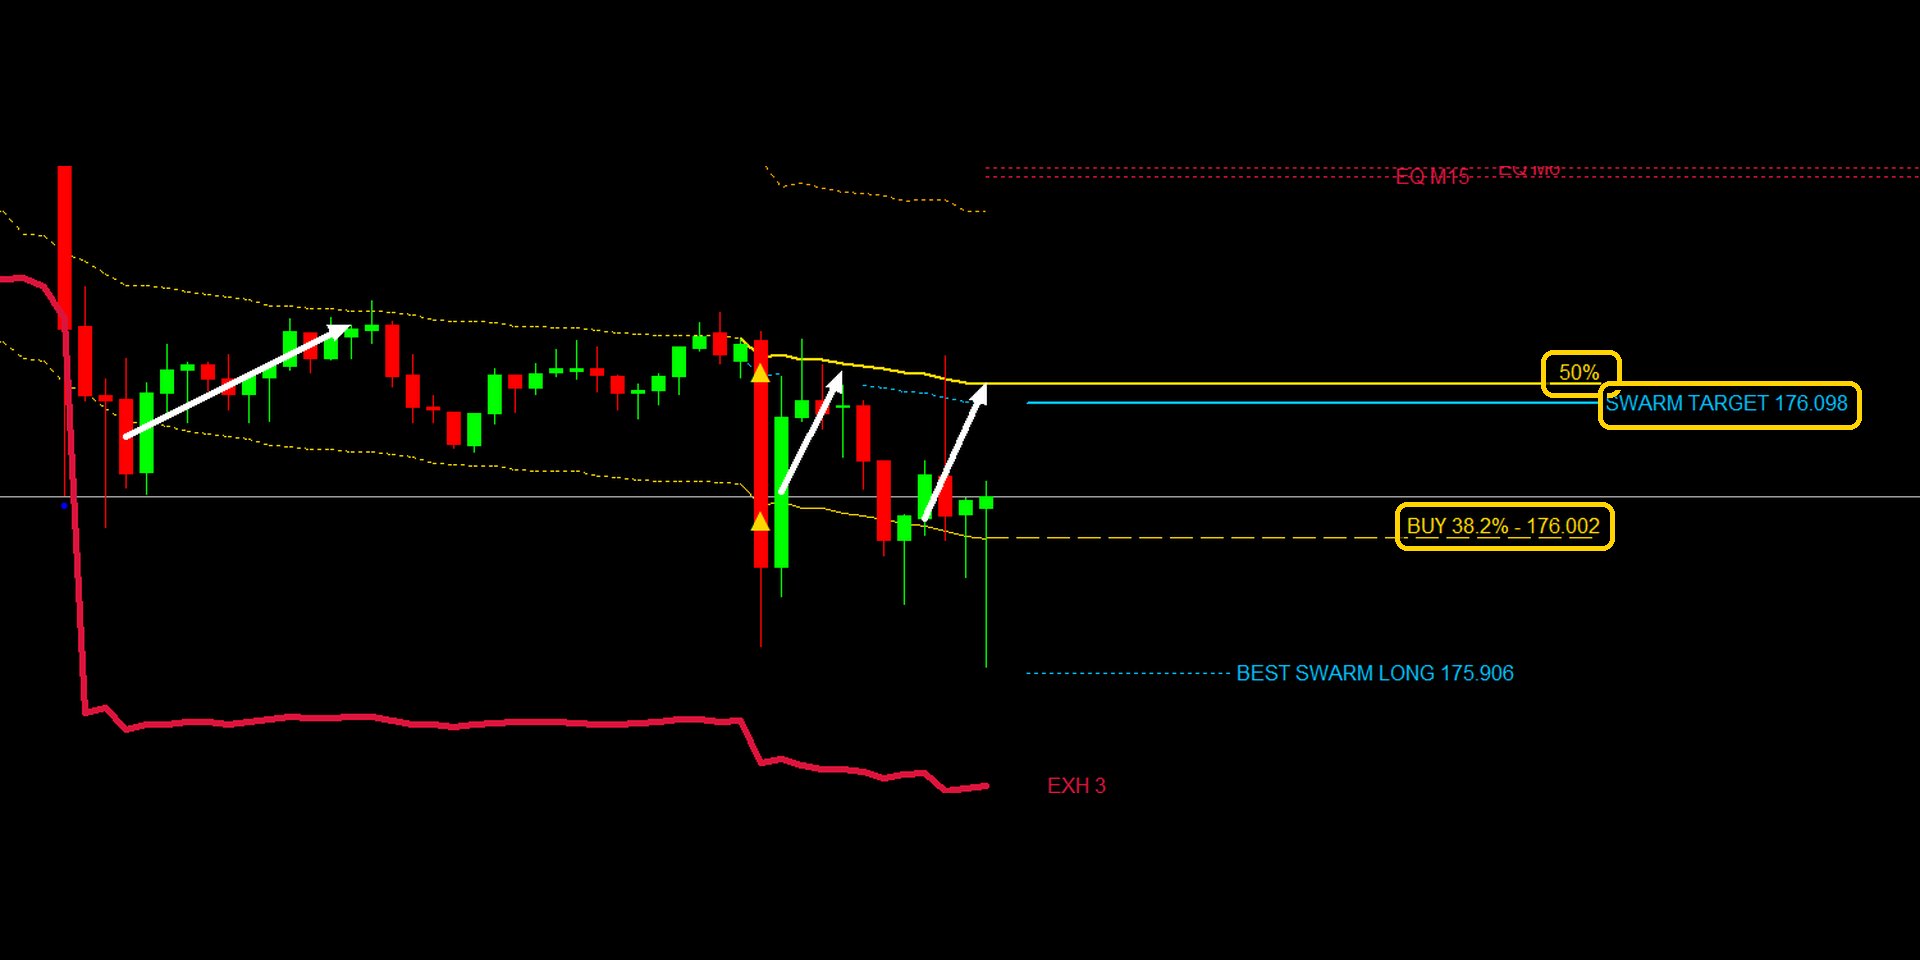
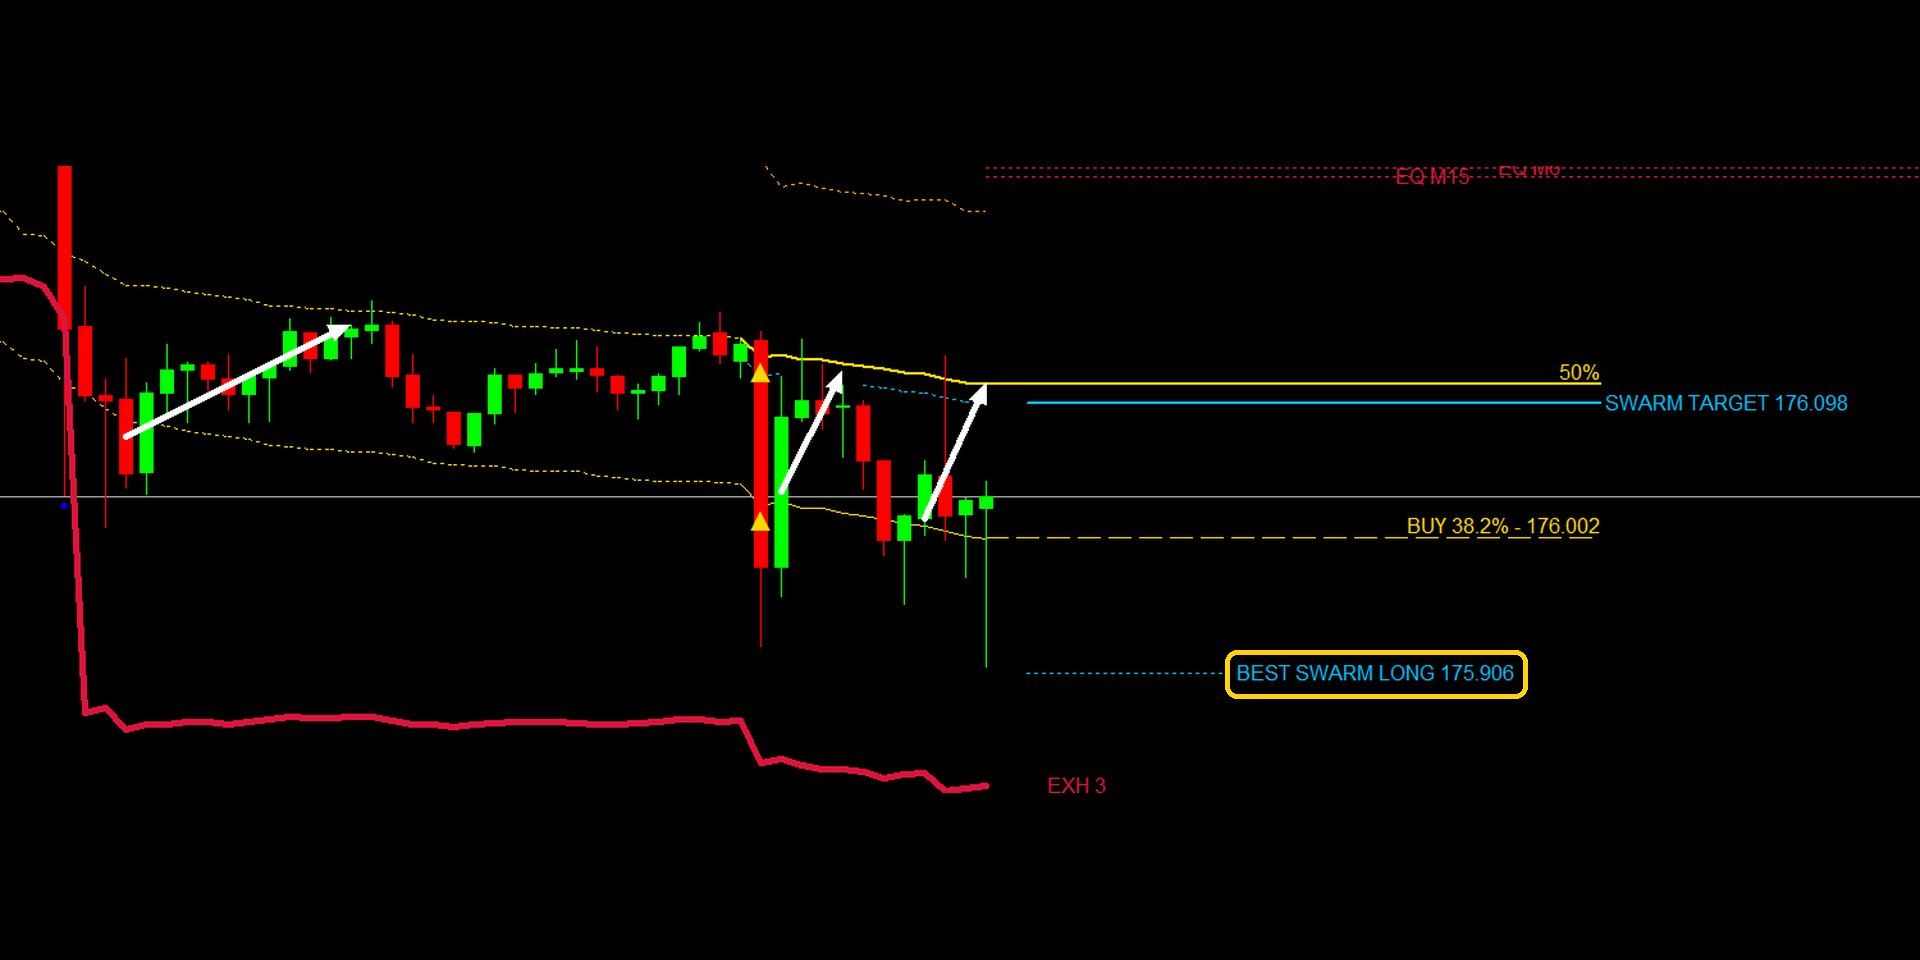
In order, for a bearish swarm, where the trade is a BUY back up towards fair value. For a bullish swarm the picture is turned upside down and the trade is a SELL. From BEST SWARM up to 50% the distances are to scale: SWARM TARGET is 7/8 of the way from 38.2% to 50%, and BEST SWARM is the same distance beyond 38.2%. The equilibrium is further away than drawn.
- EQUILIBRIUM
- The equilibrium of the swarm's highest timeframe: the fair value the price is pulled back to.
- 50%: the amber light
- Read it as advance notice, like a traffic light turning amber: the band is stretching, get ready. It is not a target.
- SWARM TARGET
- 7/8 of the way from 38.2% back to 50%. It appears once the price has gone beyond 38.2% and stays until it is reached. The profit is taken here, well before the equilibrium, and on purpose: the goal is to take money out of the market every day, not to be right about where it goes. MERAVITH EA takes its profit at the same level.
- 38.2%: the entry
- Here the price is taken to have gone too far from its fair value. The best moment is when the price goes beyond it. The Swarm IN alarm rings when the price reaches it.
- BEST SWARM LONG / SHORT
- The SWARM TARGET mirrored beyond 38.2%: the best price to add to the position.
Examples
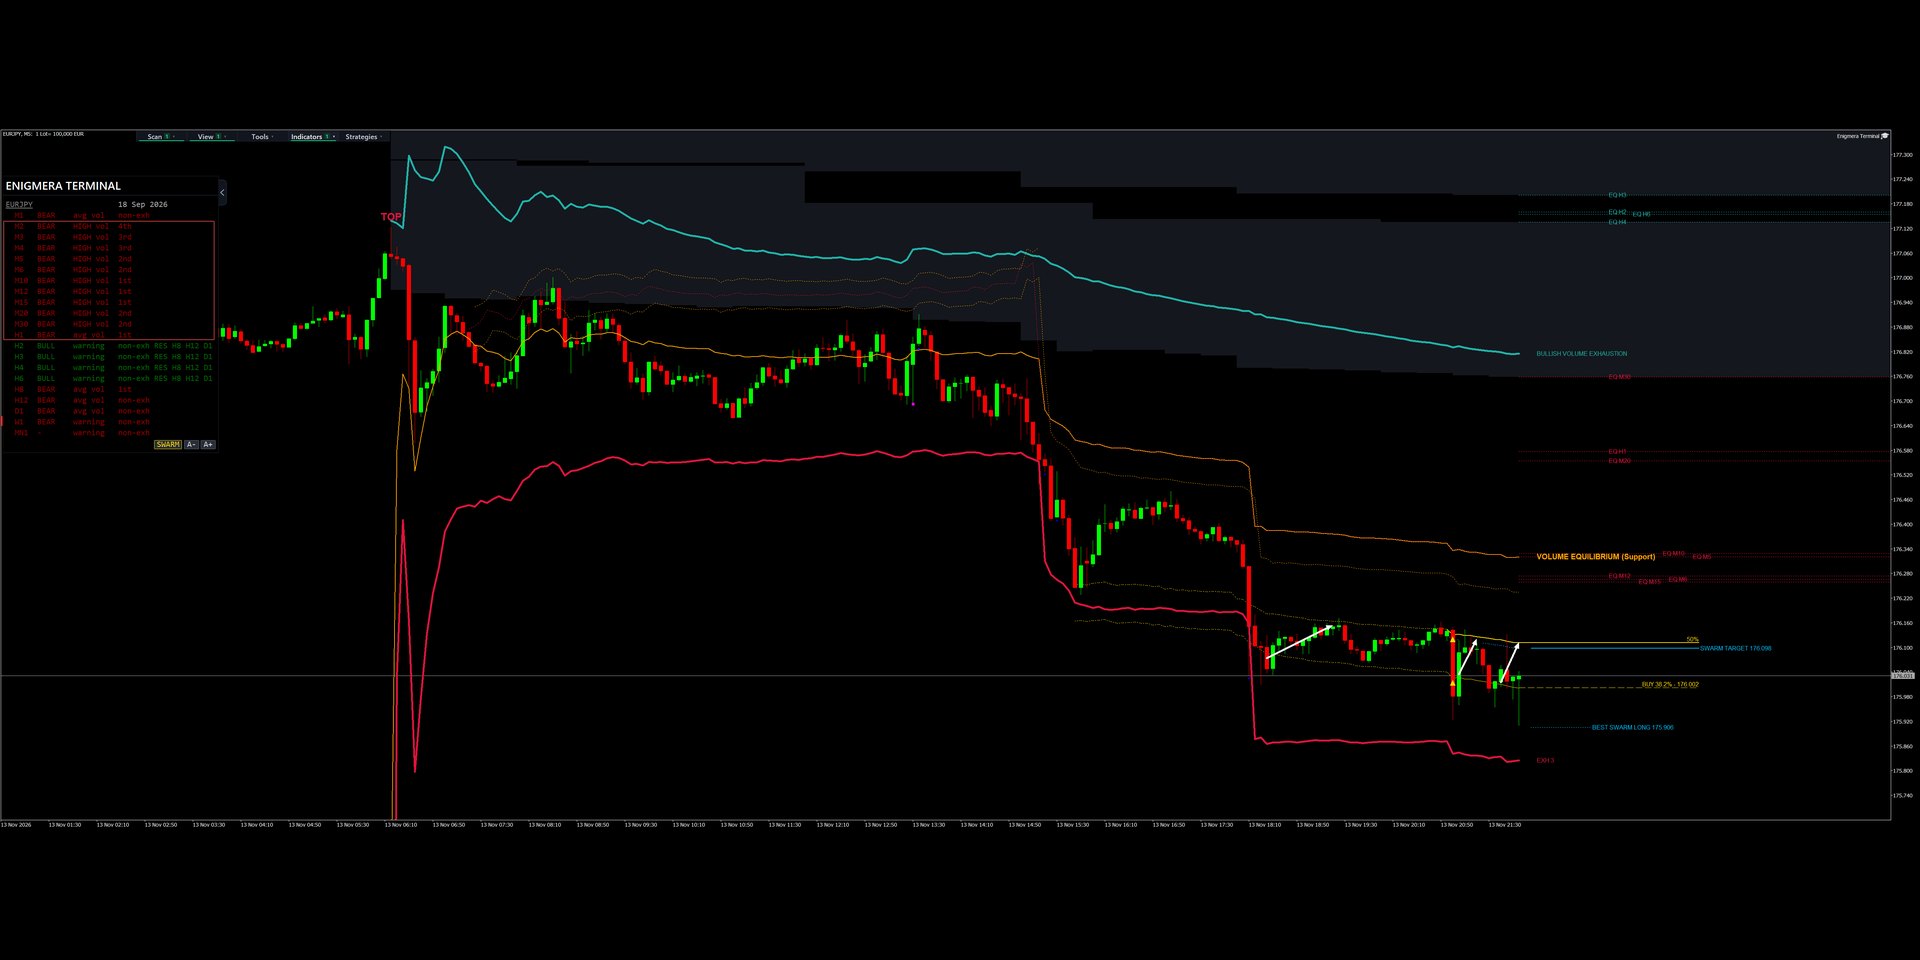
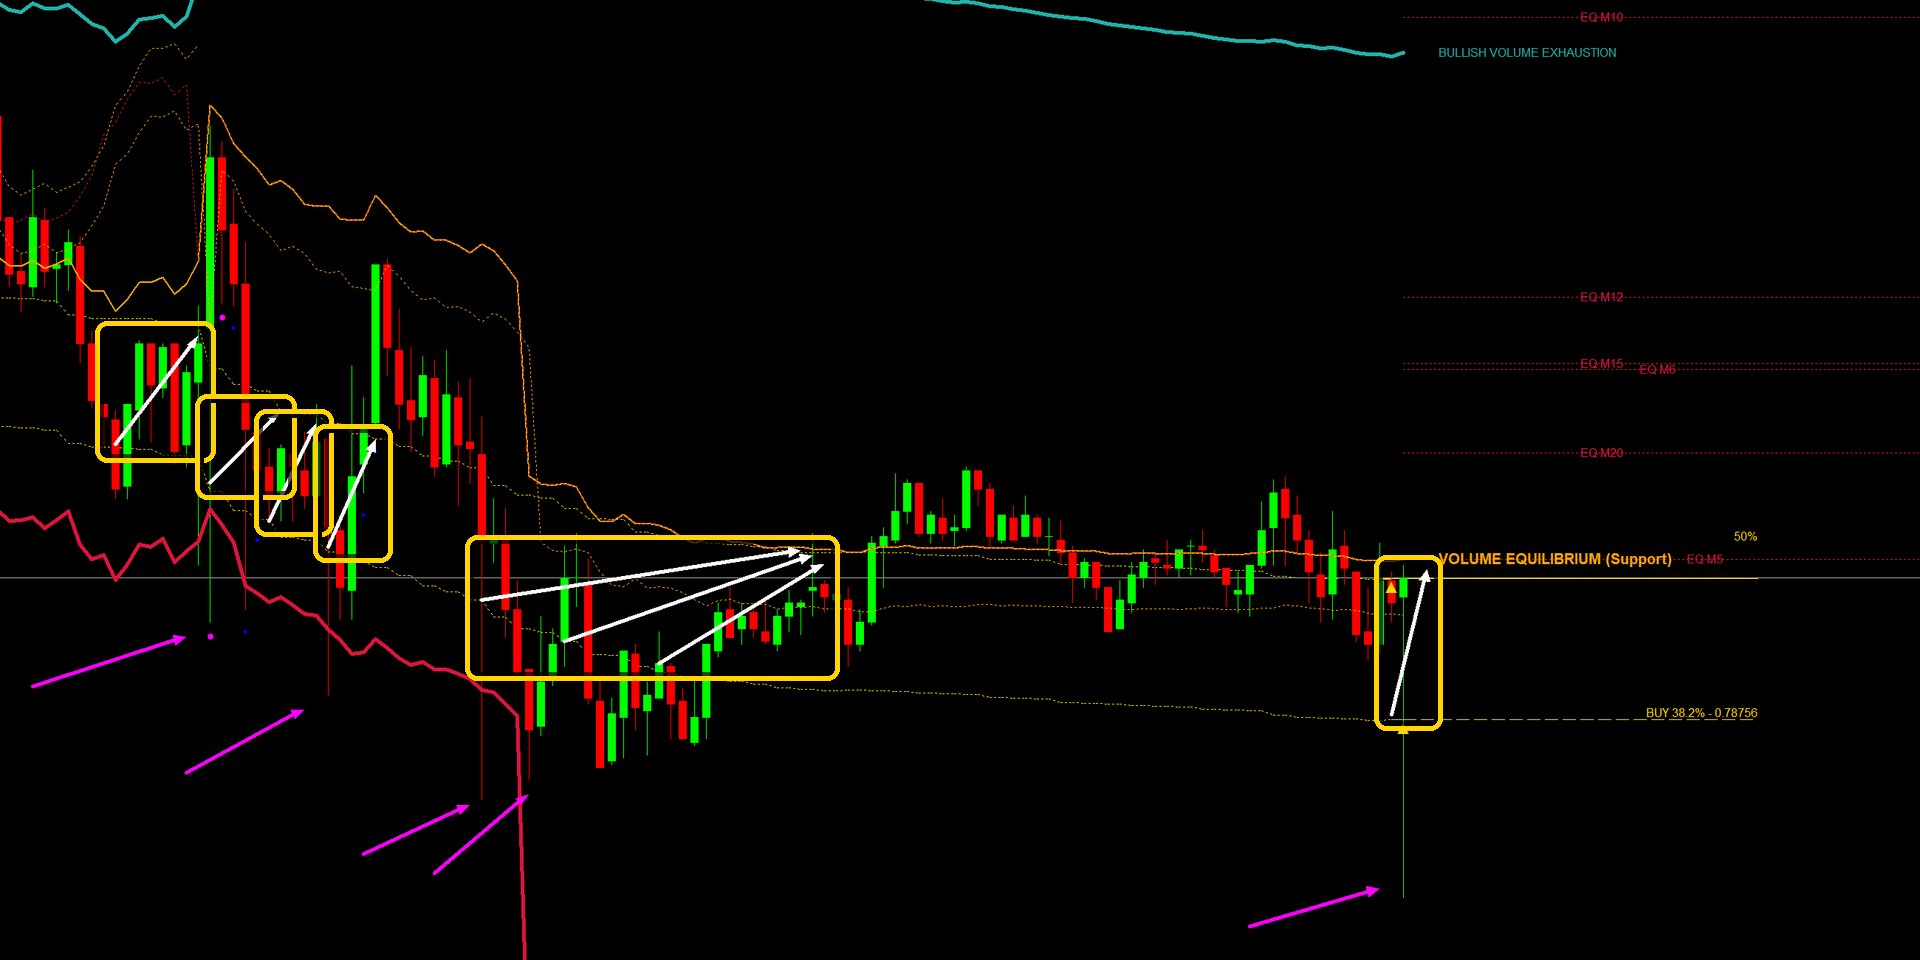
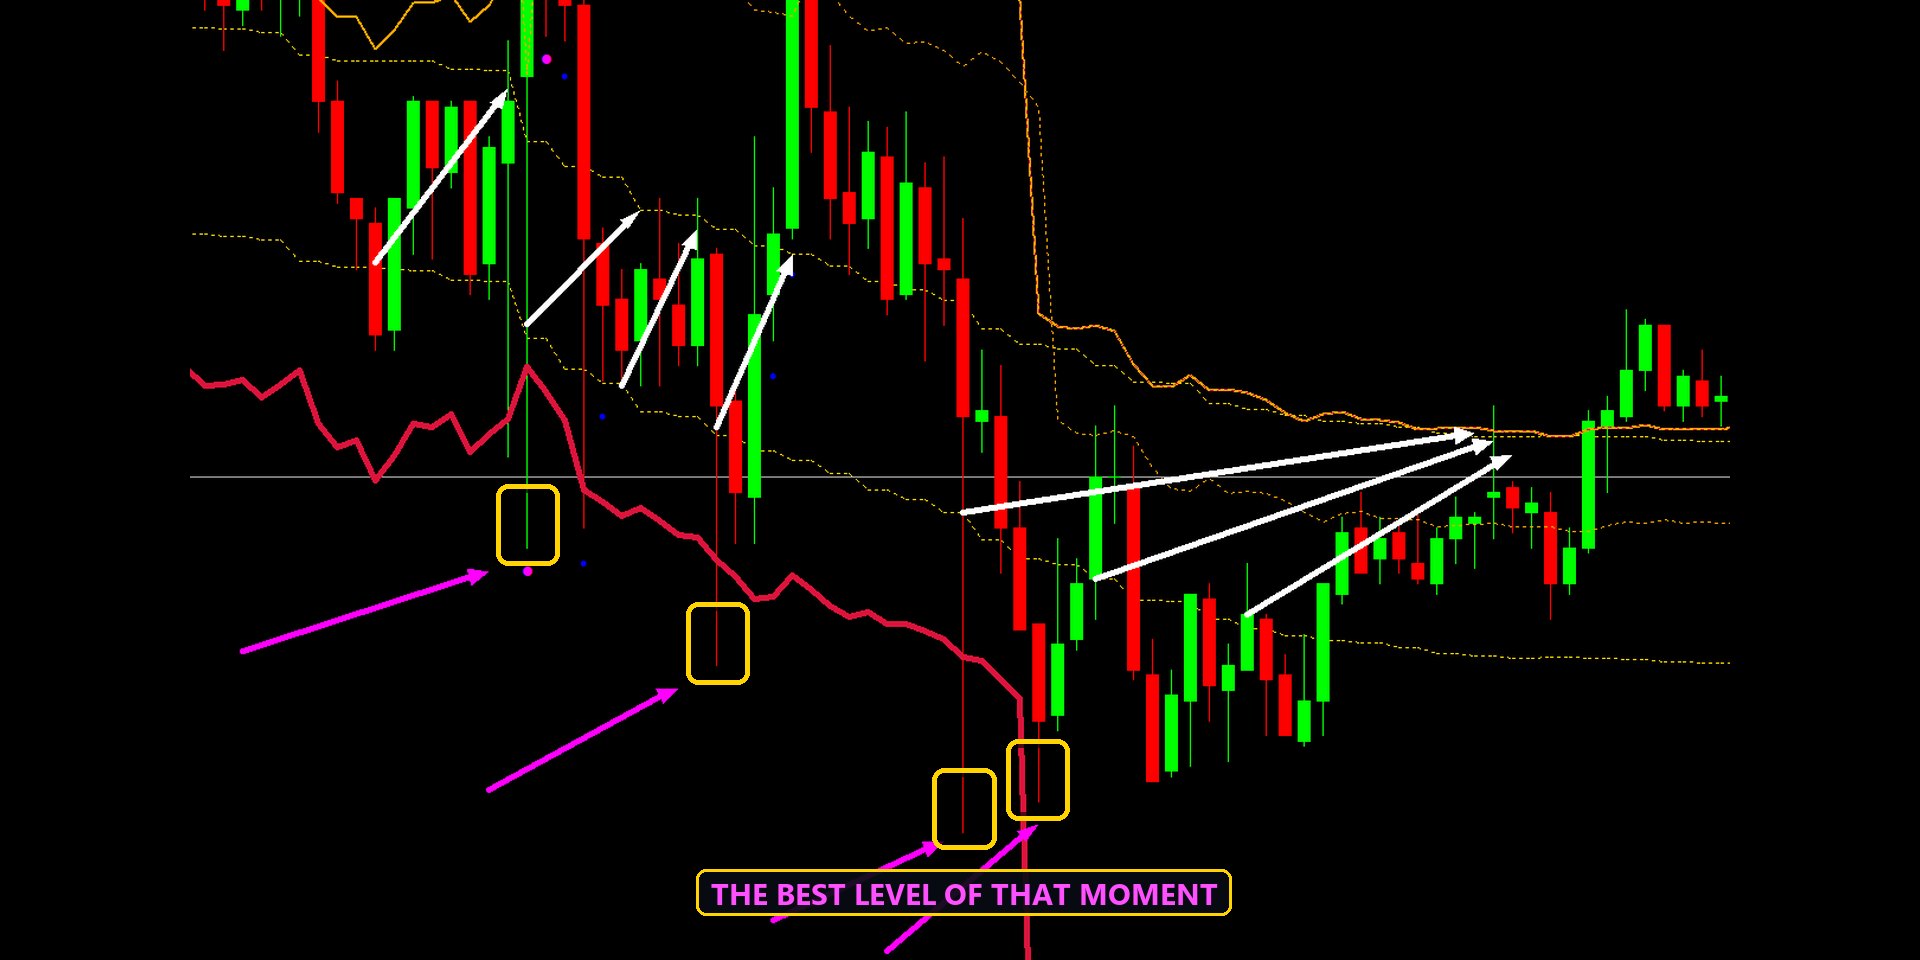
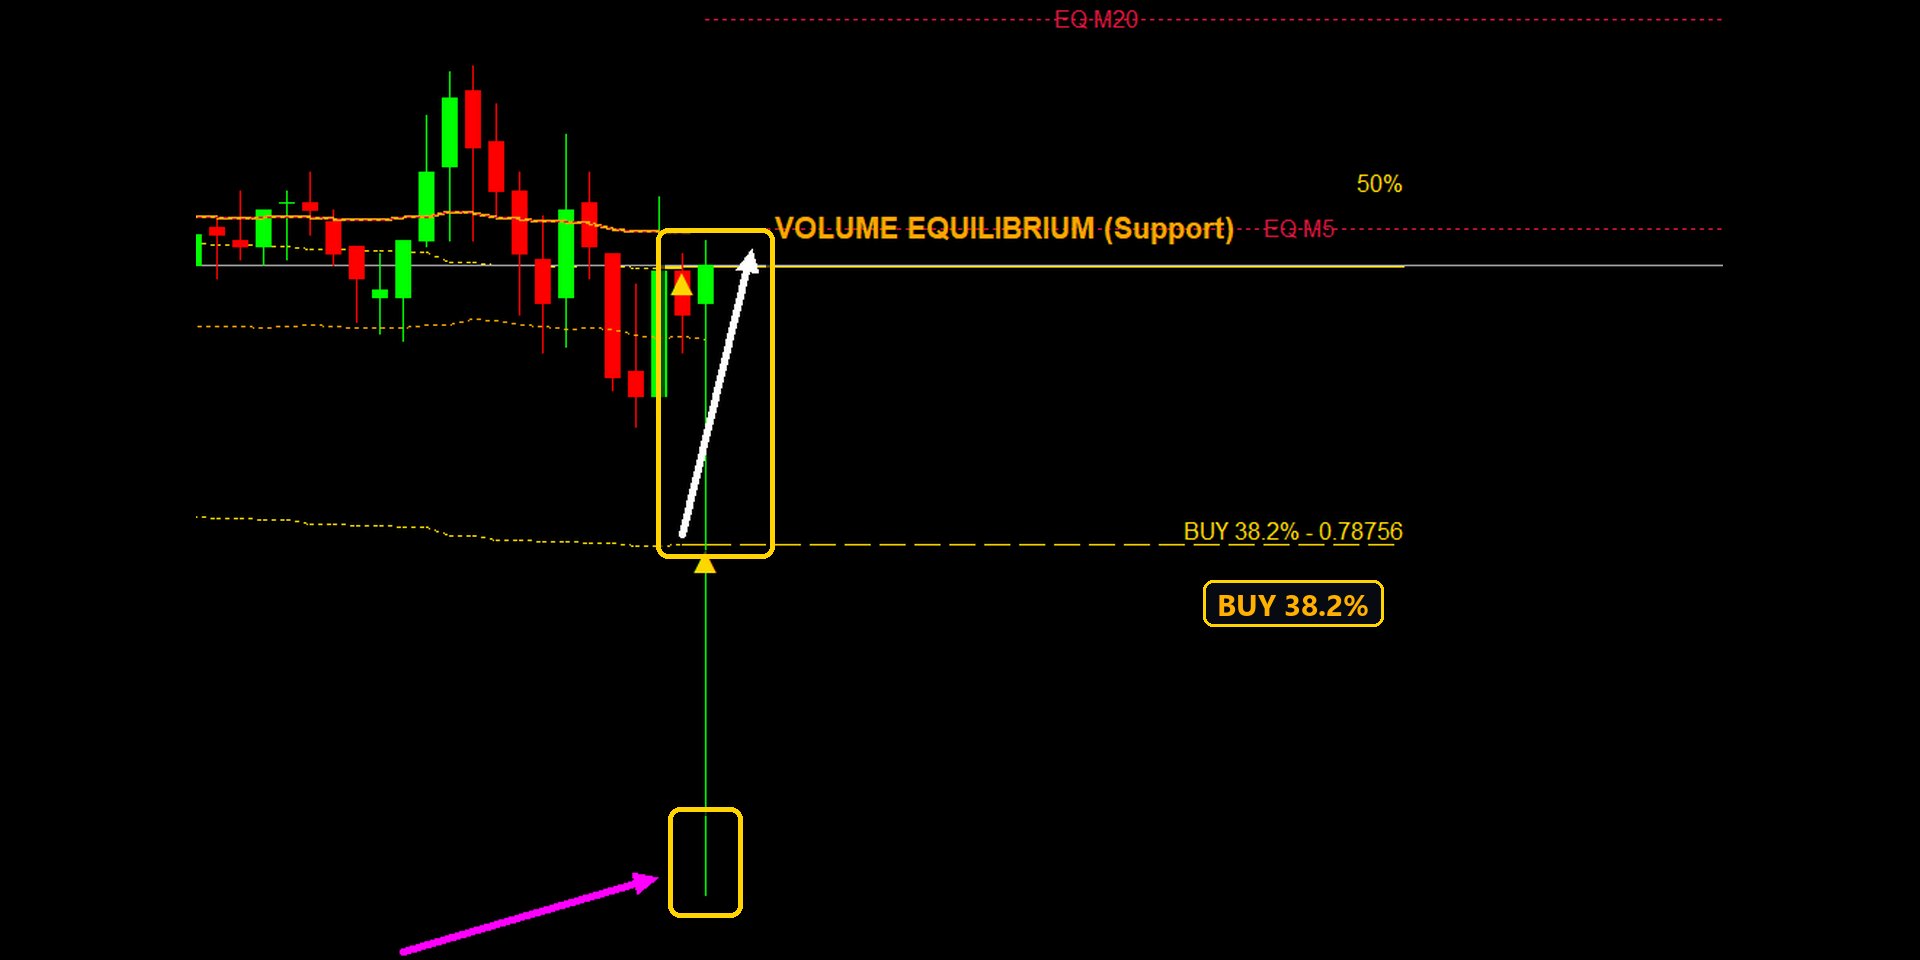
Two pairs on the five-minute chart in the Enigmera Terminal, Friday 13 November 2026. Friday evening is a good moment for the SWARM: the positions of the week are closed. The white arrows are the trades, drawn by hand.
EURJPY: three trades in one evening
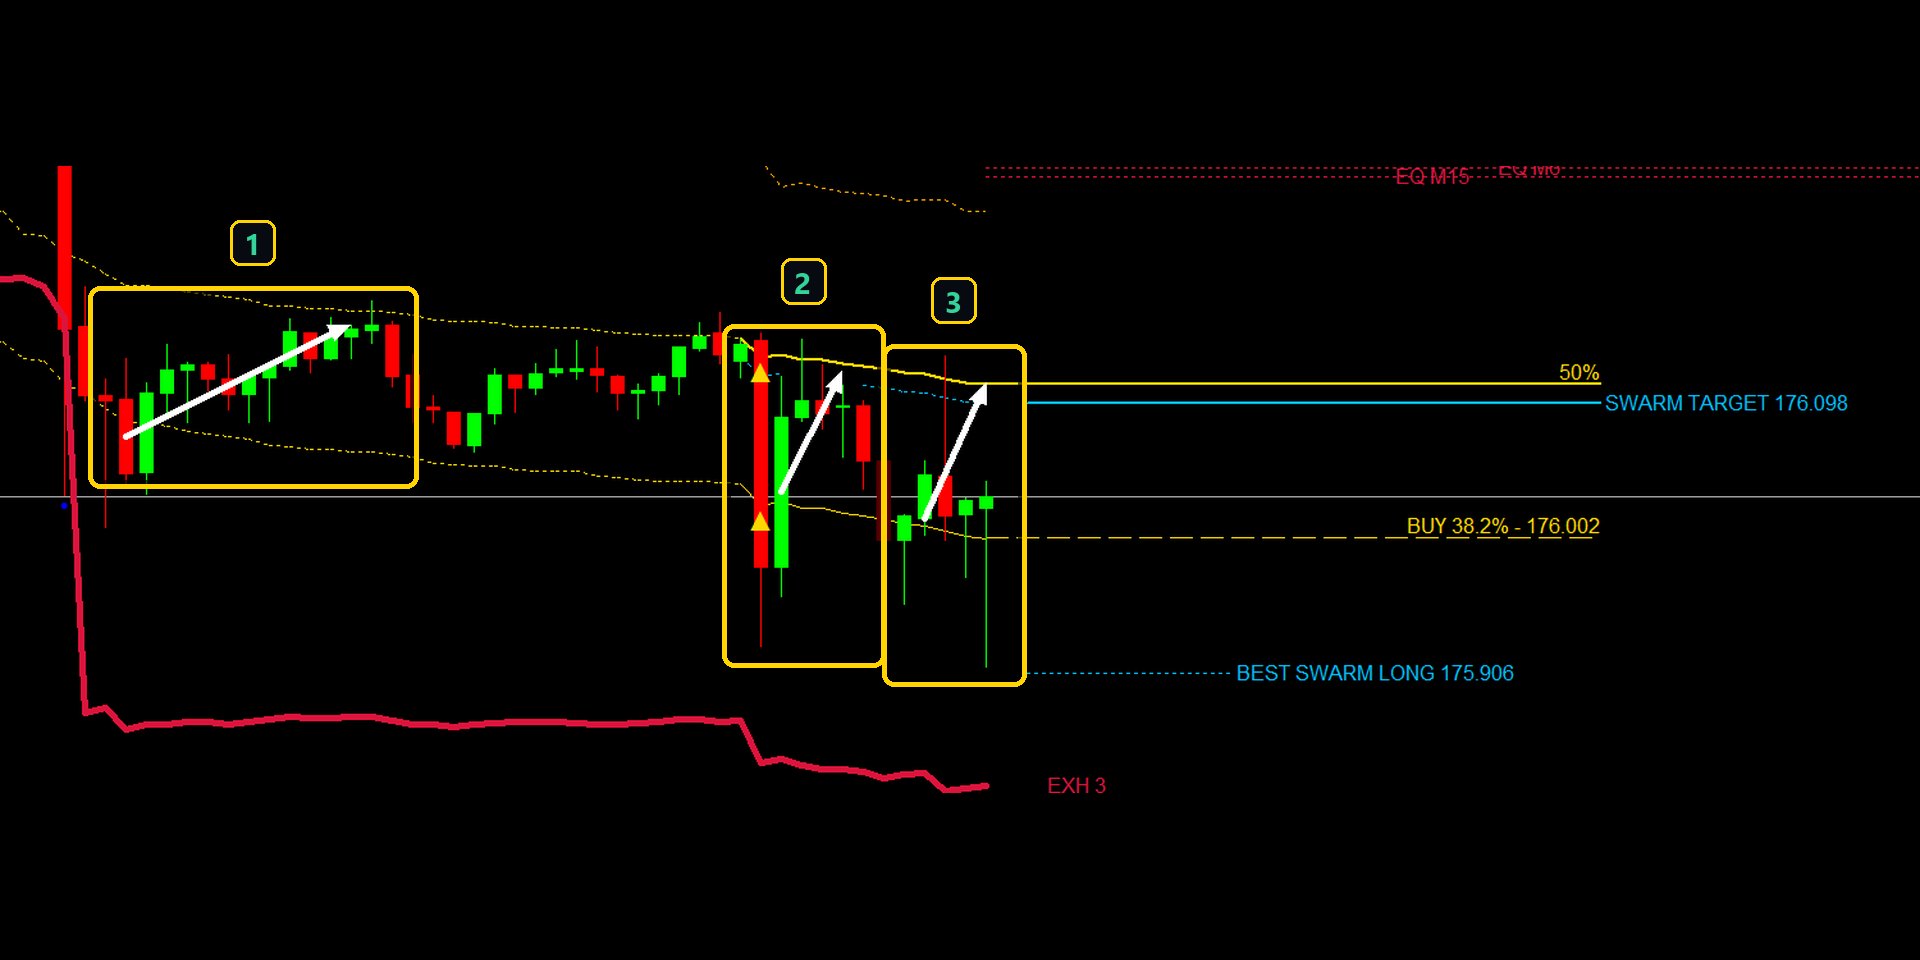
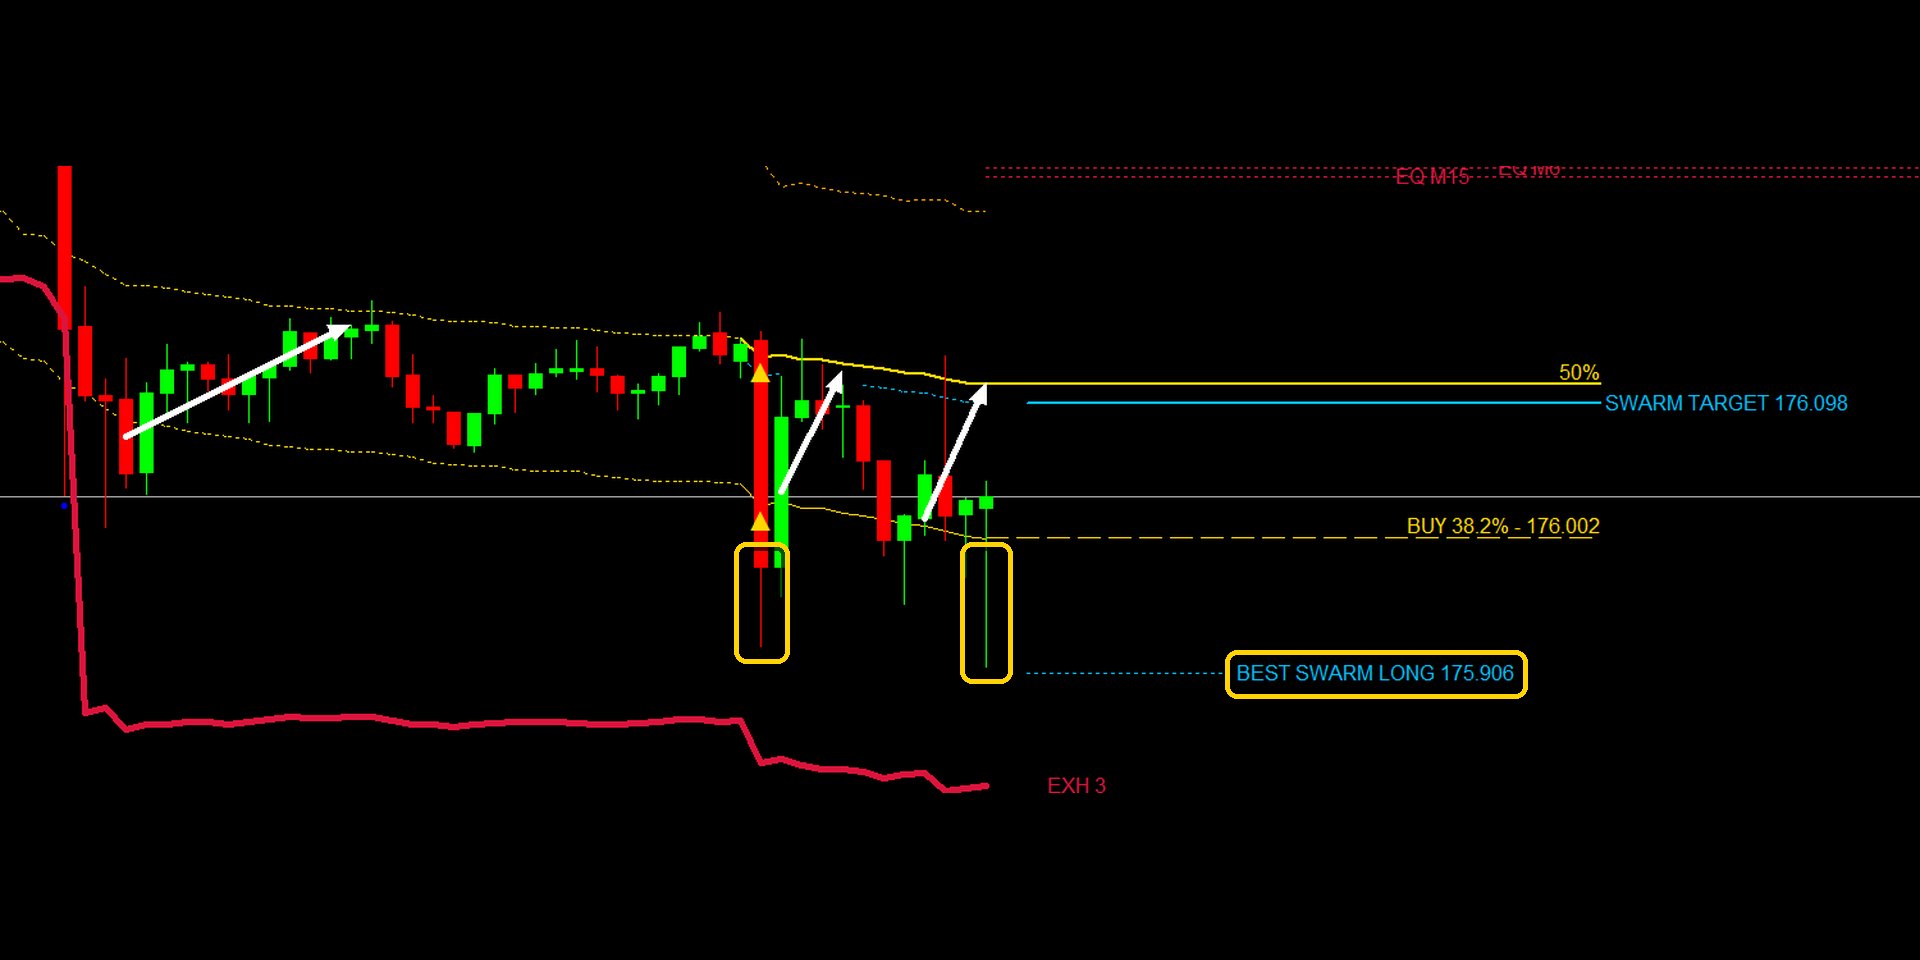
NZDCAD: close to eight trades in one day
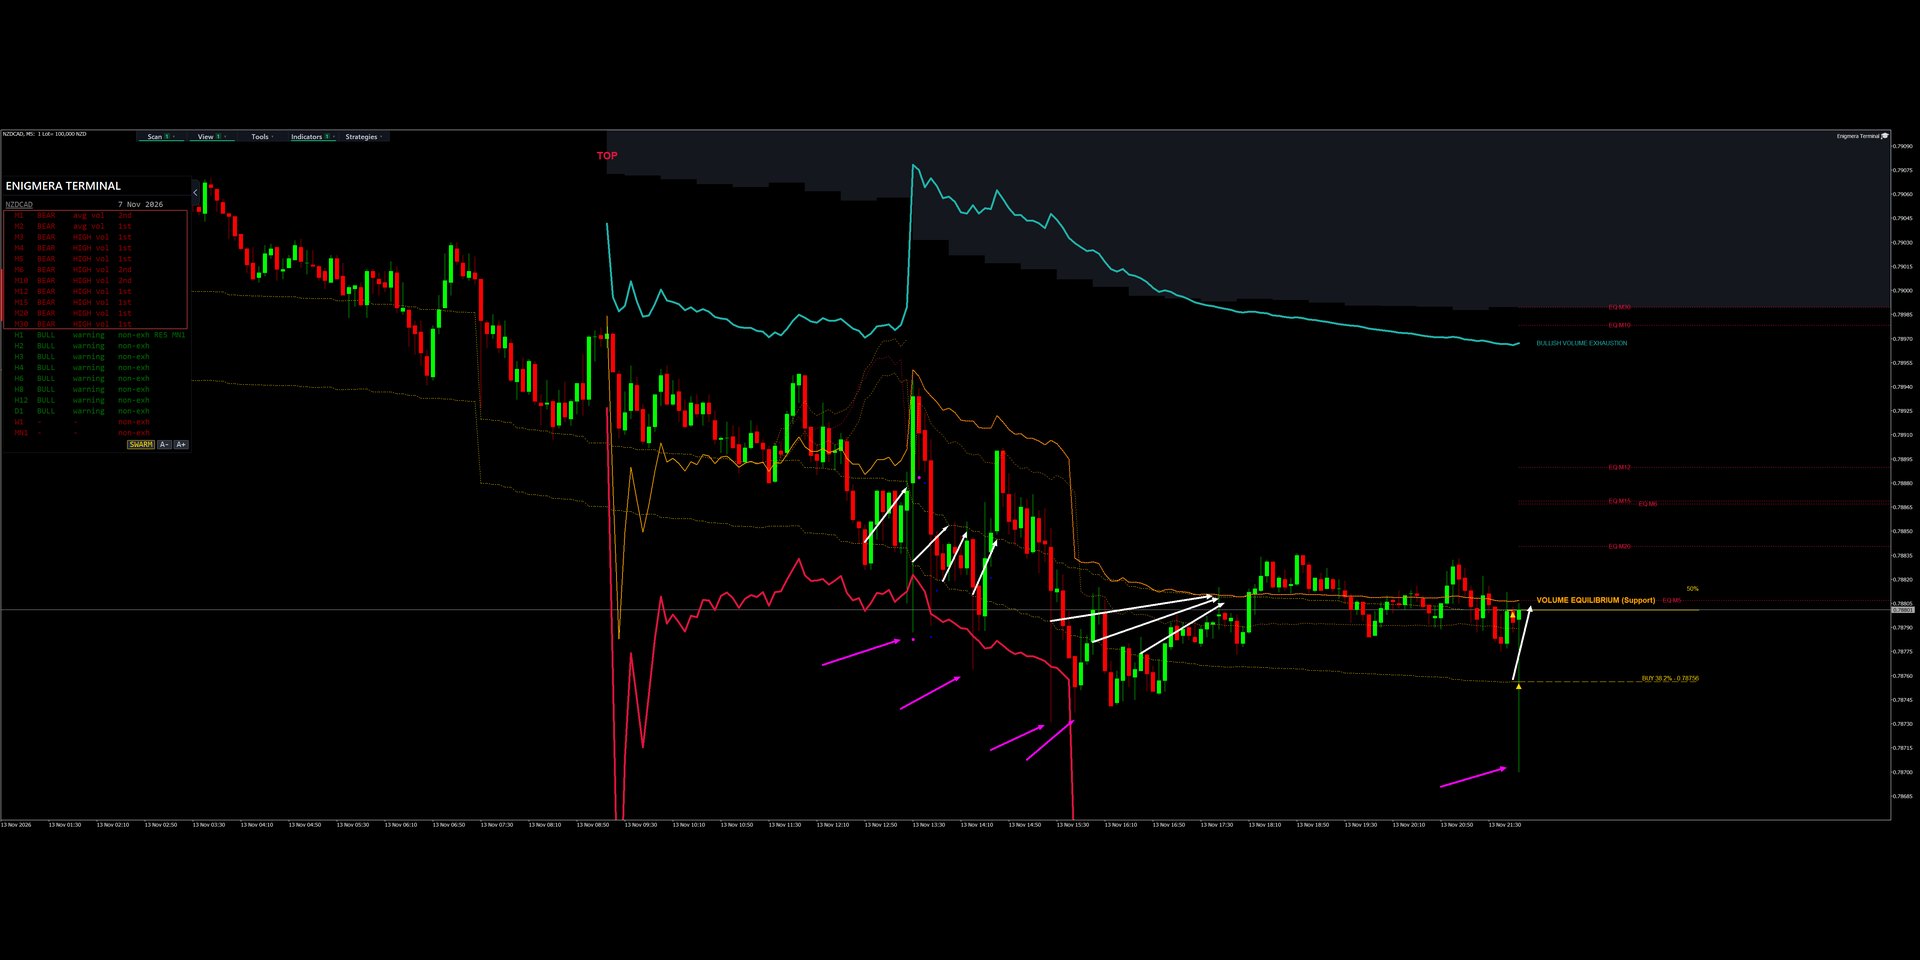
On the screen
- Press S to read every timeframe of the pair, then SWARM at the foot of the board. Every swarm on the board gets a frame.
- The swarm that holds the chart's timeframe breathes (its frame pulses) and its lines are on the chart: the equilibrium, BUY or SELL 50% and 38.2%, SWARM TARGET and BEST SWARM, and the curves back in time. When the chart's timeframe is in no swarm, the longest swarm is used. Other swarms keep a still, dimmer frame.
- To see another swarm's levels, click one of its rows. The chart moves to that timeframe and that swarm's lines appear.
- On the M board (SCANNER and Enigmera Terminal) every scanned pair's swarms are shown, each with its own row or frame. A click opens that pair.
A swarm shows where a turn is likely to start, not that it must start. The examples above were chosen to show how the levels work; not every swarm turns at its 38.2% level.